Fig. B.3
Download original image
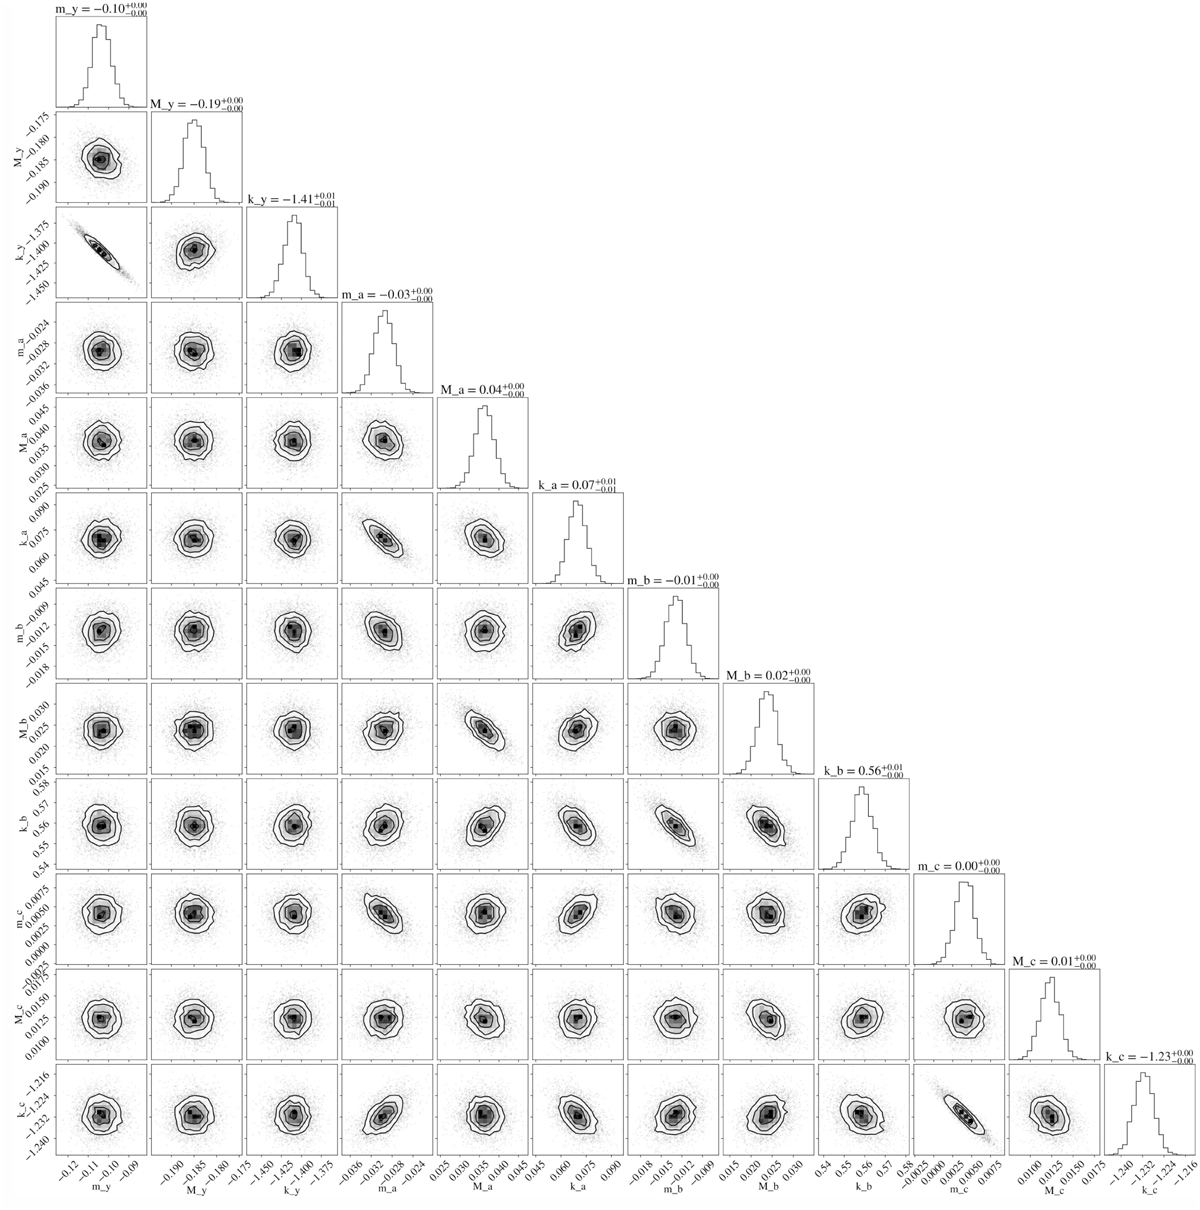
The corner plot of the best-fitting parameters of Eq. 6, for fitting log(![]() ) as a function of the rescaled true input log(NIV′), across all simulations spanning count rates from 0.001 cts/s to 30 cts/s, and number of bins from 50 to 1000. The values of the best fit parameters shown here differ from those displayed in Table 1, as the fit was performed for log(
) as a function of the rescaled true input log(NIV′), across all simulations spanning count rates from 0.001 cts/s to 30 cts/s, and number of bins from 50 to 1000. The values of the best fit parameters shown here differ from those displayed in Table 1, as the fit was performed for log(![]() ) as a function of the rescaled
) as a function of the rescaled ![]() . Table 1 instead shows the parameter values for the fit of log(
. Table 1 instead shows the parameter values for the fit of log(![]() ) as a function of log(NIV), and those are the ones that should be used for estimating NEVb from
) as a function of log(NIV), and those are the ones that should be used for estimating NEVb from ![]() .
.
Current usage metrics show cumulative count of Article Views (full-text article views including HTML views, PDF and ePub downloads, according to the available data) and Abstracts Views on Vision4Press platform.
Data correspond to usage on the plateform after 2015. The current usage metrics is available 48-96 hours after online publication and is updated daily on week days.
Initial download of the metrics may take a while.