Fig. A.5
Download original image
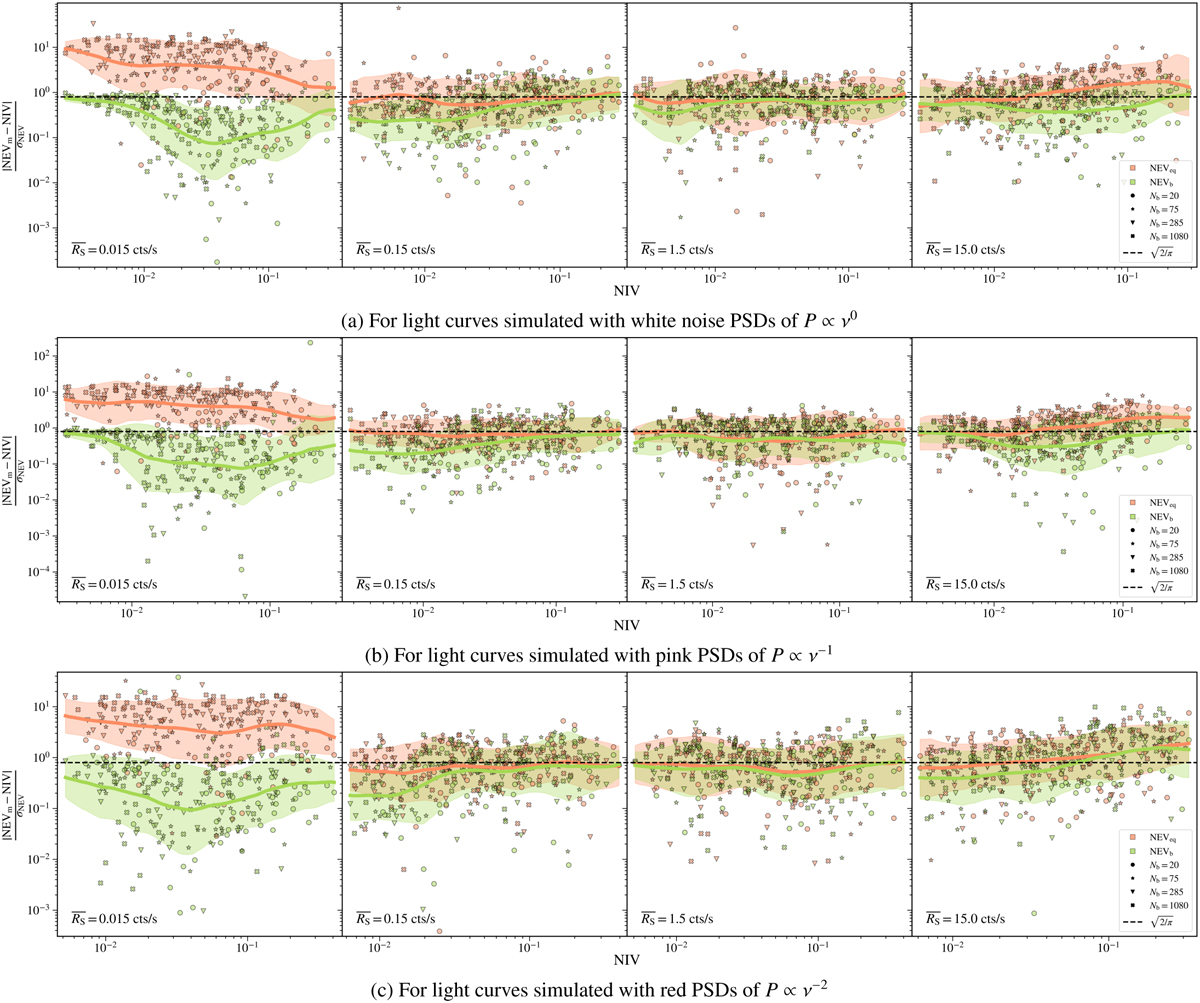
Accuracy of the uncertainties of NEVeq and NEVb, for a range of different count rates, number of bins, and types of PSDs. This figure used the results of the same simulated light curves as are displayed in Fig. A.4. The parameter NEVm denotes a NIV estimate, which is either NEVb, or NEVeq. The parameter σm denotes the uncertainty in the measurement. The black dashed line at a value of ![]() , indicates the level that |NEVm – NIV| /σNEV,m = |Zm| should have. This figure excludes points from simulated light curves with very negative values of NEVeq for which the error cannot be determined. Other features are similar to those of Fig. A.4.
, indicates the level that |NEVm – NIV| /σNEV,m = |Zm| should have. This figure excludes points from simulated light curves with very negative values of NEVeq for which the error cannot be determined. Other features are similar to those of Fig. A.4.
Current usage metrics show cumulative count of Article Views (full-text article views including HTML views, PDF and ePub downloads, according to the available data) and Abstracts Views on Vision4Press platform.
Data correspond to usage on the plateform after 2015. The current usage metrics is available 48-96 hours after online publication and is updated daily on week days.
Initial download of the metrics may take a while.