Fig. A.4

Download original image
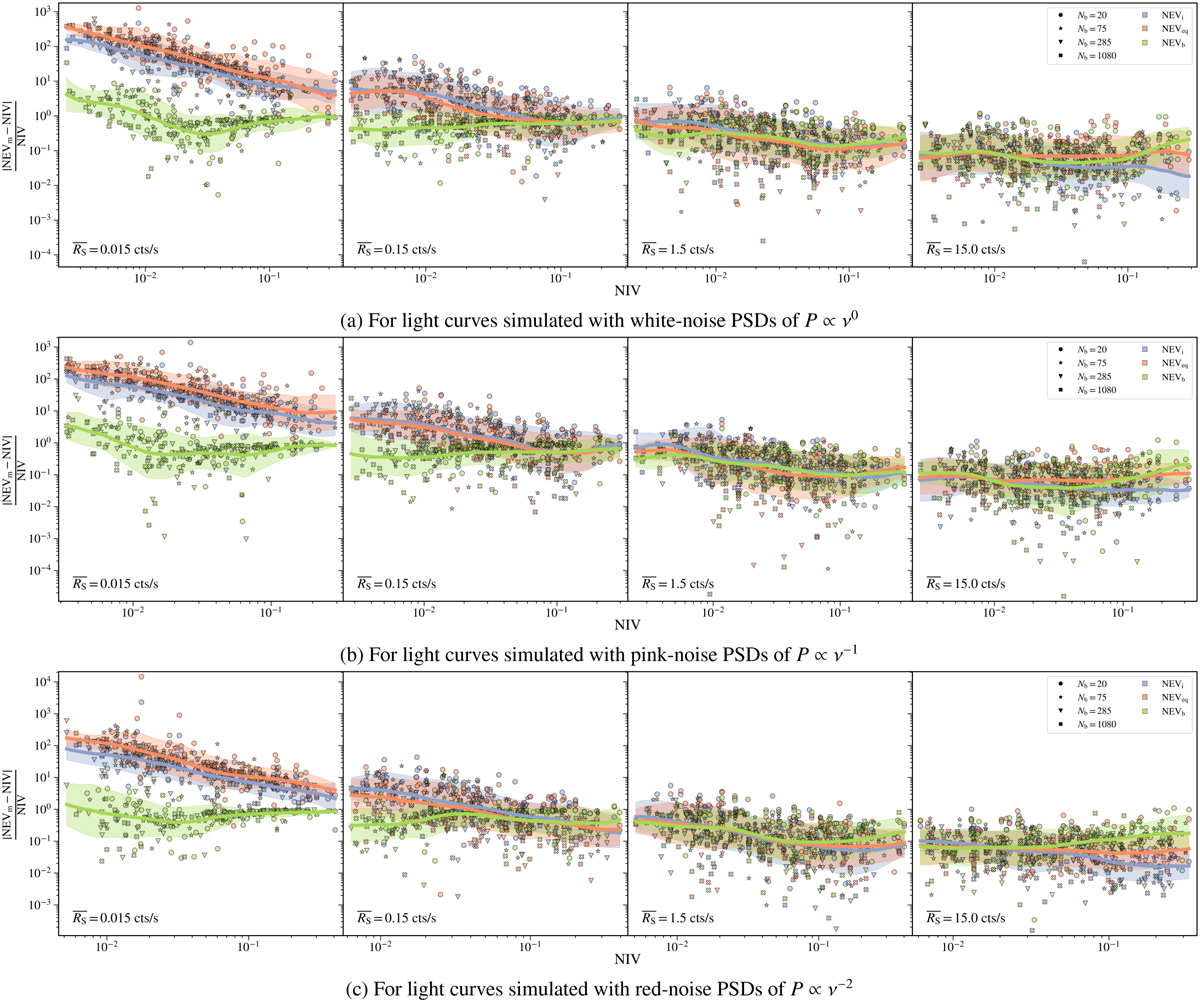
Comparison of the ability of the integral of the periodogram (NEVi), the modified NEV equation (NEVeq), and the bexvar NIV estimate (NEVb), to accurately estimate the NIV of eROSITA-like light curves. This figure plots the absolute value of the difference between the measured value, NEVm (which refers to either NEVi, NEVeq, or NEVb), and the NIV (NIV), normalised by the NIV, as a function of the NIV. The lower the value of this parameter, the more accurate the estimate of the NIV is. Each data point represents one instance of a simulated light curve. The same light curves were used for computing NEVi, NEVeq, and NEVb. Each panel represents a different count rate. The dependence on the number of bins is showcased via different symbols. Figure (a), (b), (c): Accuracy of the NIV estimates for white-, pink-, and red-noise light curves, respectively. Solid lines are plotted on top of the distribution of points, corresponding to the geometric mean of the distribution of log (|NEVm – NIV|/NIV) as a function of log(NIV). Transparent areas indicate the part of the distribution corresponding to one standard deviation from the mean, in either direction.
Current usage metrics show cumulative count of Article Views (full-text article views including HTML views, PDF and ePub downloads, according to the available data) and Abstracts Views on Vision4Press platform.
Data correspond to usage on the plateform after 2015. The current usage metrics is available 48-96 hours after online publication and is updated daily on week days.
Initial download of the metrics may take a while.


