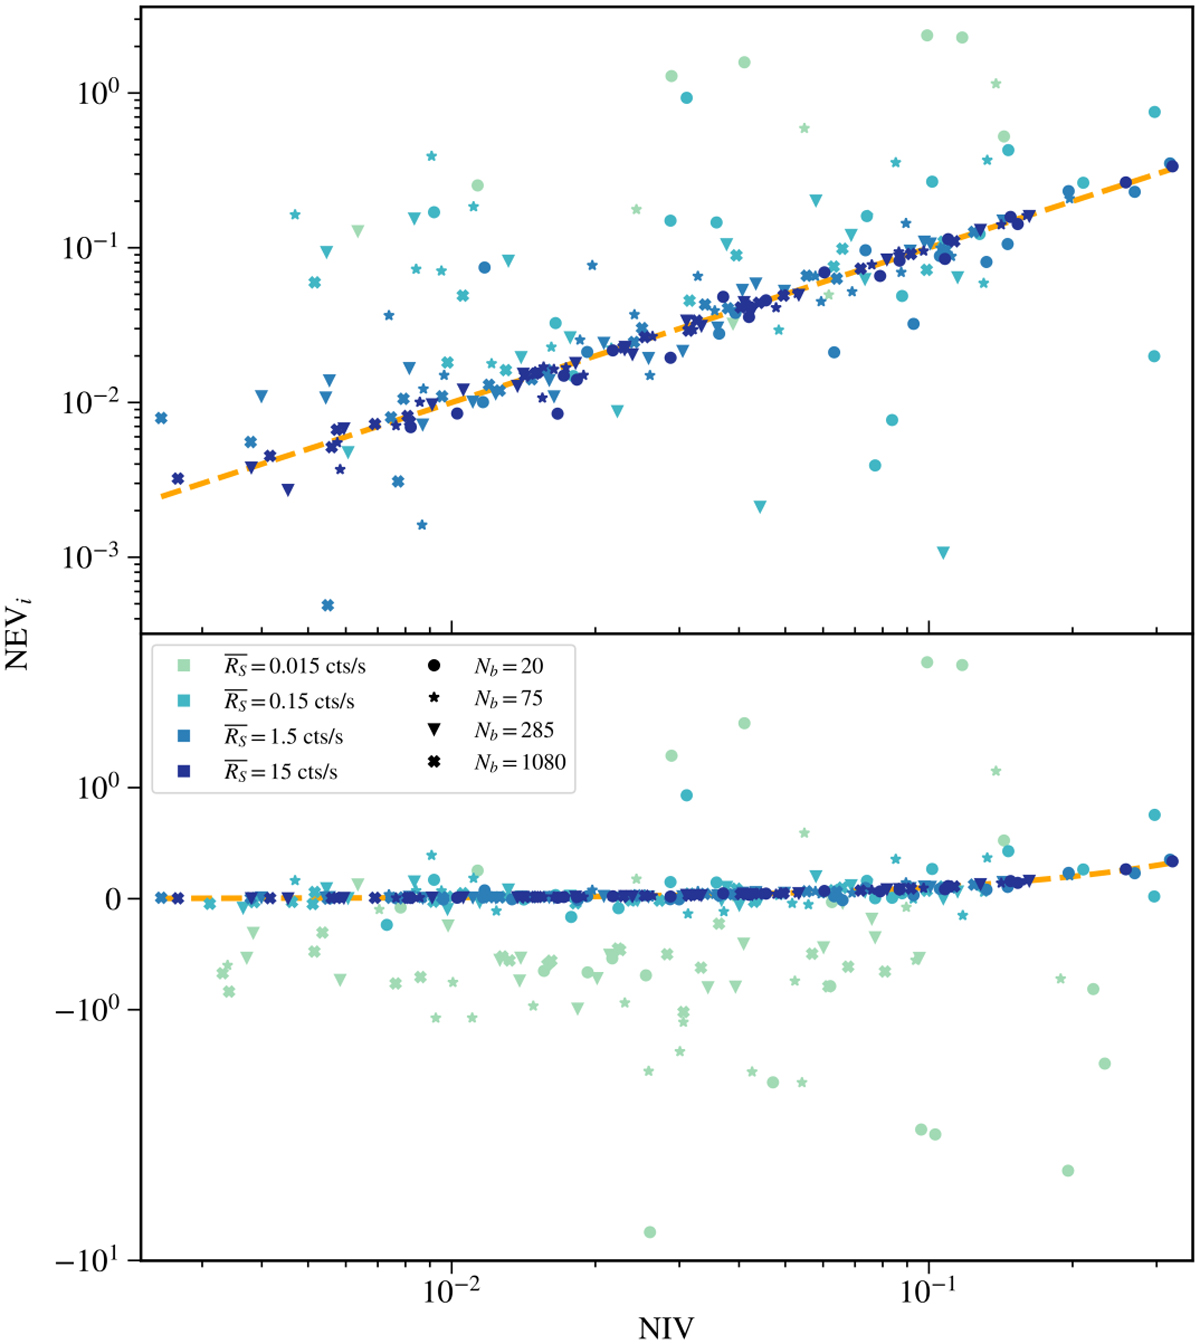
Fig. A.2
Download original image
Accuracy of estimating the NIV by integrating periodograms of simulated eROSITA-like pink-noise light curves. Unlike in Fig. A.1, the NIV is estimated here by subtracting both the Poisson and fractional-exposure noise, using Eqs. 16, and 17, with parameters listed in Table 4 from the periodograms. This figure shows the relationship on both a logarithmic (top panel) and a symmetric logarithmic (lower panel) scale, to showcase how close the individual NEVi measurements are to the NIV, as well as the complete range of values measured for NEVi.
Current usage metrics show cumulative count of Article Views (full-text article views including HTML views, PDF and ePub downloads, according to the available data) and Abstracts Views on Vision4Press platform.
Data correspond to usage on the plateform after 2015. The current usage metrics is available 48-96 hours after online publication and is updated daily on week days.
Initial download of the metrics may take a while.