Fig. 11
Download original image
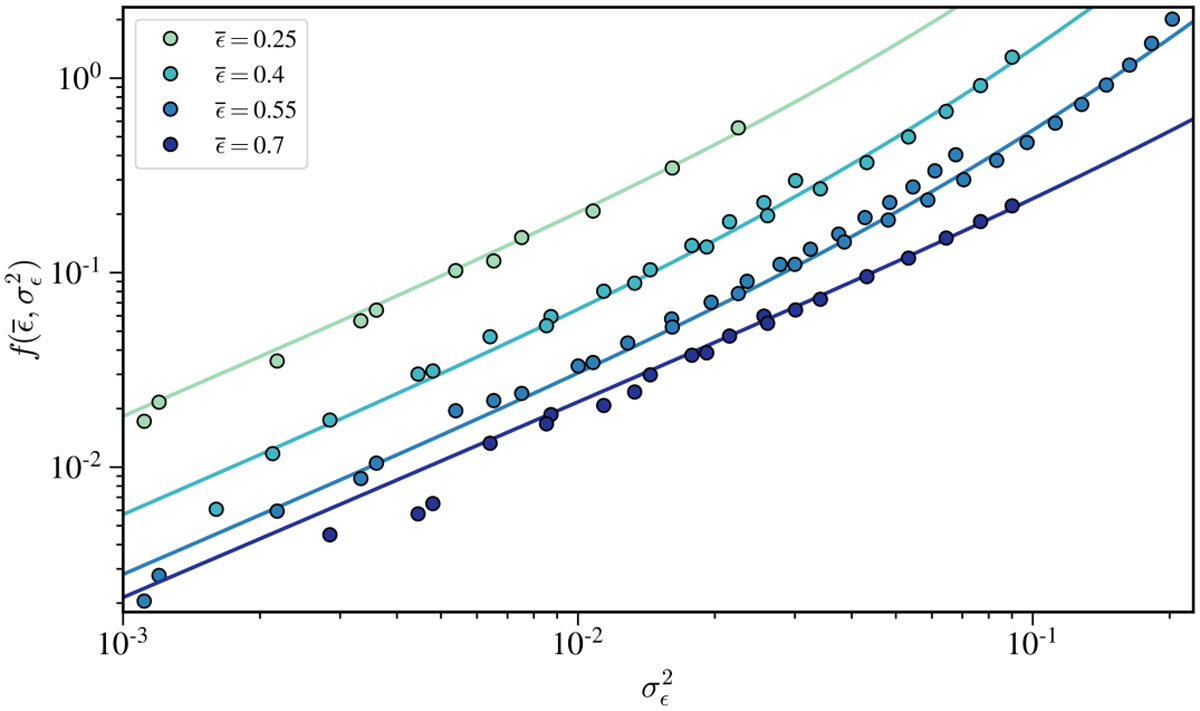
Dependence of the excess noise in a periodogram caused by varying fractional exposures, as a function of ![]() , and
, and ![]() . The data points indicate a subset of the results of the simulations used to determine
. The data points indicate a subset of the results of the simulations used to determine ![]() (Eqs. (16) and (17)). The lines indicate the best fit to all data, for four particular values of
(Eqs. (16) and (17)). The lines indicate the best fit to all data, for four particular values of ![]() , using Eq. (17), and the parameter values in Table 4.
, using Eq. (17), and the parameter values in Table 4.
Current usage metrics show cumulative count of Article Views (full-text article views including HTML views, PDF and ePub downloads, according to the available data) and Abstracts Views on Vision4Press platform.
Data correspond to usage on the plateform after 2015. The current usage metrics is available 48-96 hours after online publication and is updated daily on week days.
Initial download of the metrics may take a while.