Fig. 1
Download original image
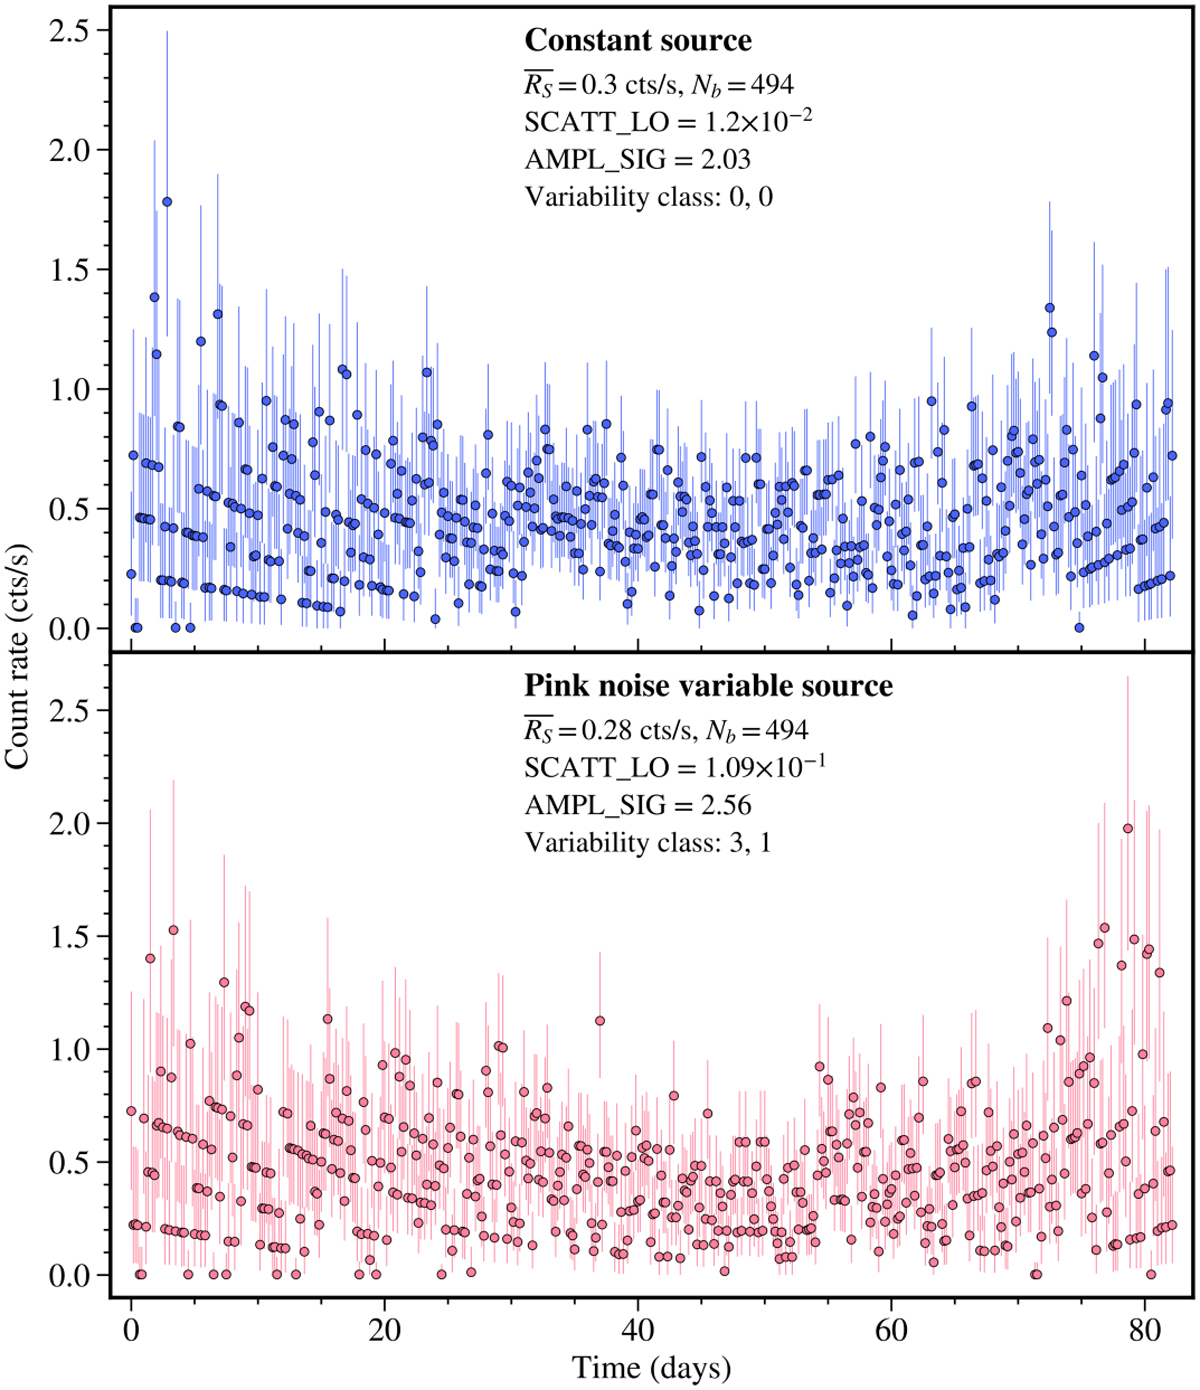
Simulated eROSITA-like light curves of a source lying close to either of the two ecliptic poles. These light curves are computed using a typical є evolution, as observed in actual eROSITA light curves. The top panel shows an intrinsically constant source, and the lower panel depicts an intrinsically-variable pink-noise source, both with an average count rate of ≈0.3 cts s−1. The variability class describes how the value of SCATT_LO and AMPL_SIG compares to the variability thresholds computed in Sect. 4. The pink-noise variable source is identified to have a SCATT_LO value above the 3σ threshold but an AMPL_SIG value only above the corresponding 1σ threshold.
Current usage metrics show cumulative count of Article Views (full-text article views including HTML views, PDF and ePub downloads, according to the available data) and Abstracts Views on Vision4Press platform.
Data correspond to usage on the plateform after 2015. The current usage metrics is available 48-96 hours after online publication and is updated daily on week days.
Initial download of the metrics may take a while.