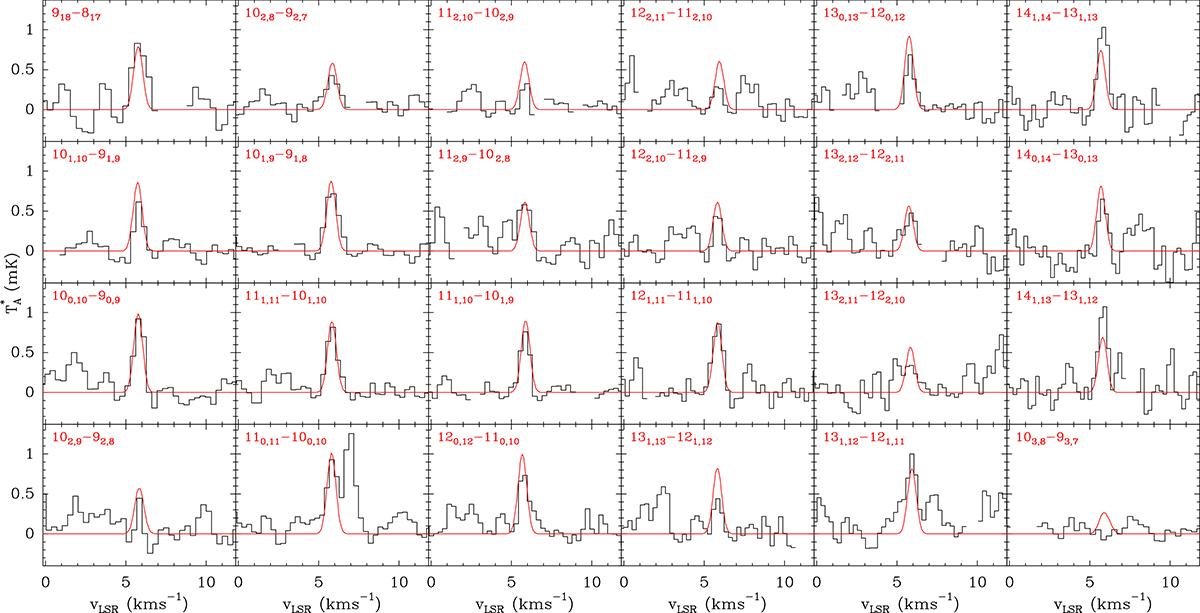
Fig. 3.
Download original image
Observed lines of NCCHCS in TMC-1. The abscissa corresponds to the velocity scale that was derived using the frequencies given in Table B.1 for which a vLSR of 5.83 kms−1 was adopted (Cernicharo et al. 2020). The ordinate is the antenna temperature in milliKelvin. The blank channels correspond to negative features produced in the folding of the frequency-switching data. The red spectra correspond to the synthetic line profiles modeled with a rotational temperature of 8.5 K and a column density of 1.2 × 1011 cm−2.
Current usage metrics show cumulative count of Article Views (full-text article views including HTML views, PDF and ePub downloads, according to the available data) and Abstracts Views on Vision4Press platform.
Data correspond to usage on the plateform after 2015. The current usage metrics is available 48-96 hours after online publication and is updated daily on week days.
Initial download of the metrics may take a while.