Fig. A.4.
Download original image
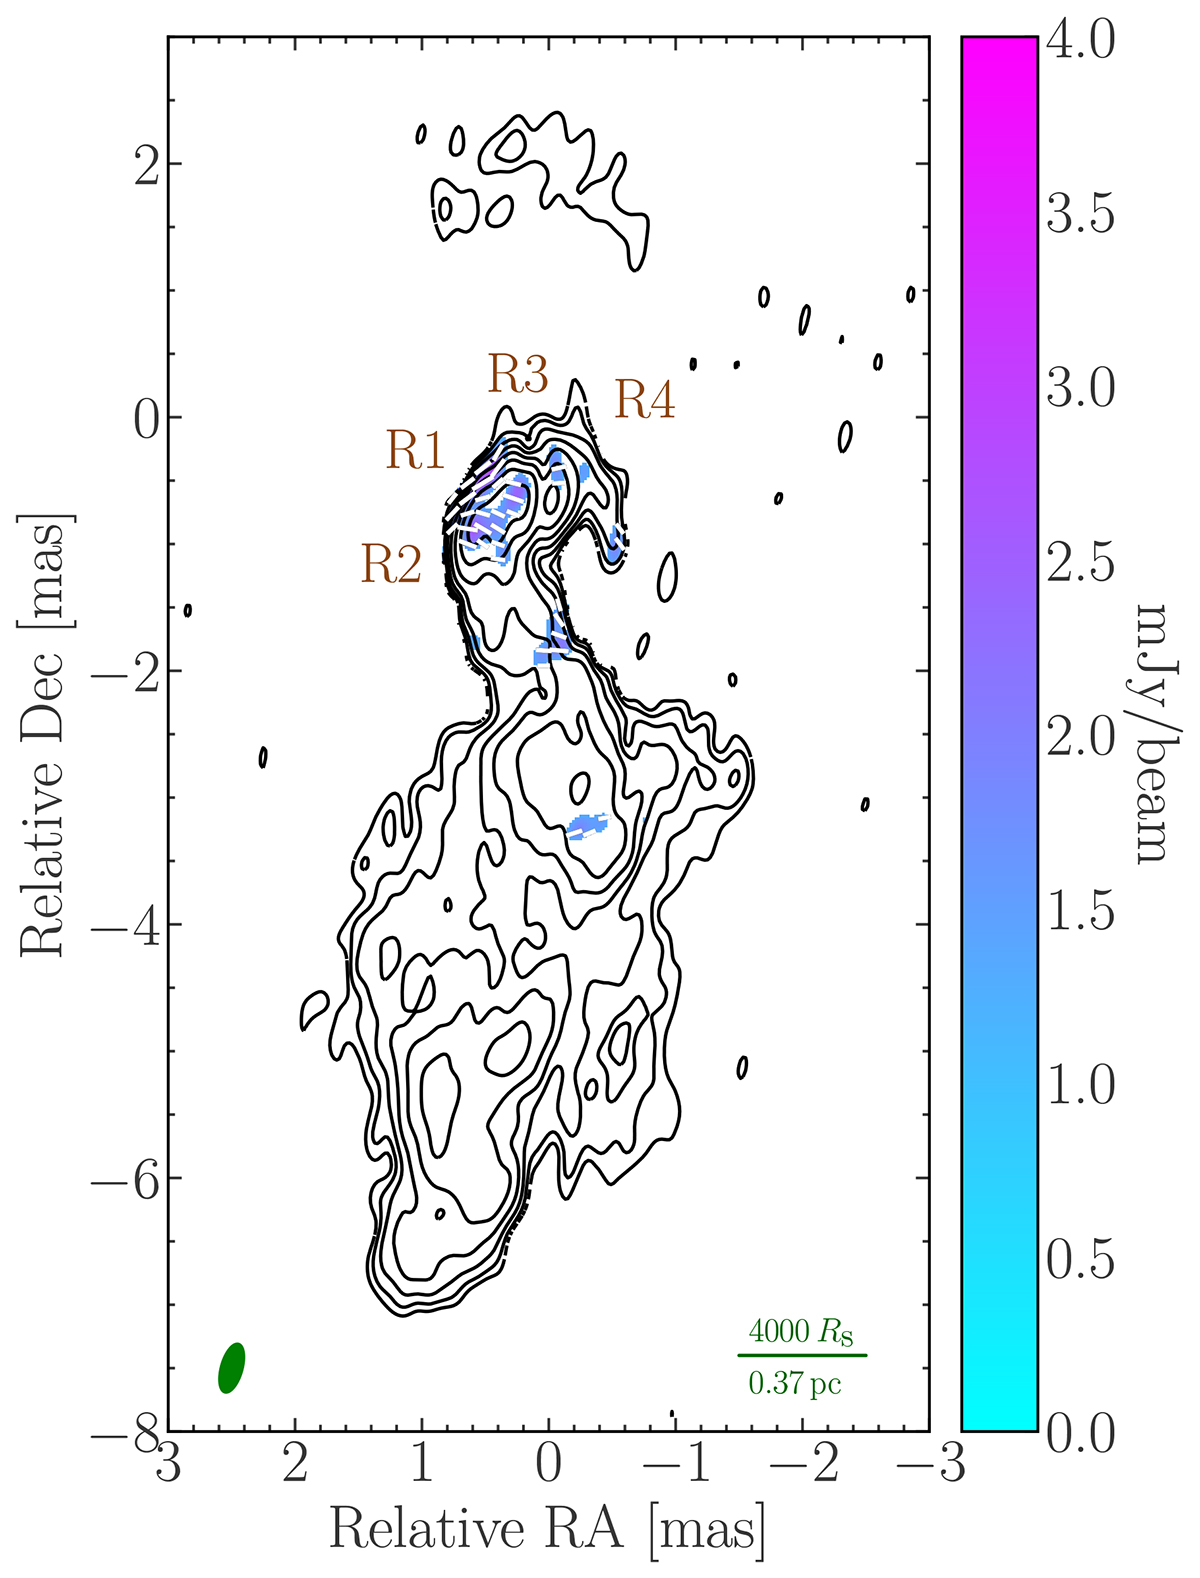
Alternative EVN image of Stokes I (black contours), polarised intensity (colour scale), and EVPA (white bars) of 3C 84 at 22 GHz, produced with the Dog-Hit pipeline. The plot set-up is the same as in Fig. 1; here σI = 0.3 Jy beam−1 and σP = 0.3 Jy beam−1. Regions R1 and R4 are clearly discernible, whereas regions R2 and R3 are blended together.
Current usage metrics show cumulative count of Article Views (full-text article views including HTML views, PDF and ePub downloads, according to the available data) and Abstracts Views on Vision4Press platform.
Data correspond to usage on the plateform after 2015. The current usage metrics is available 48-96 hours after online publication and is updated daily on week days.
Initial download of the metrics may take a while.