Fig. 2.
Download original image
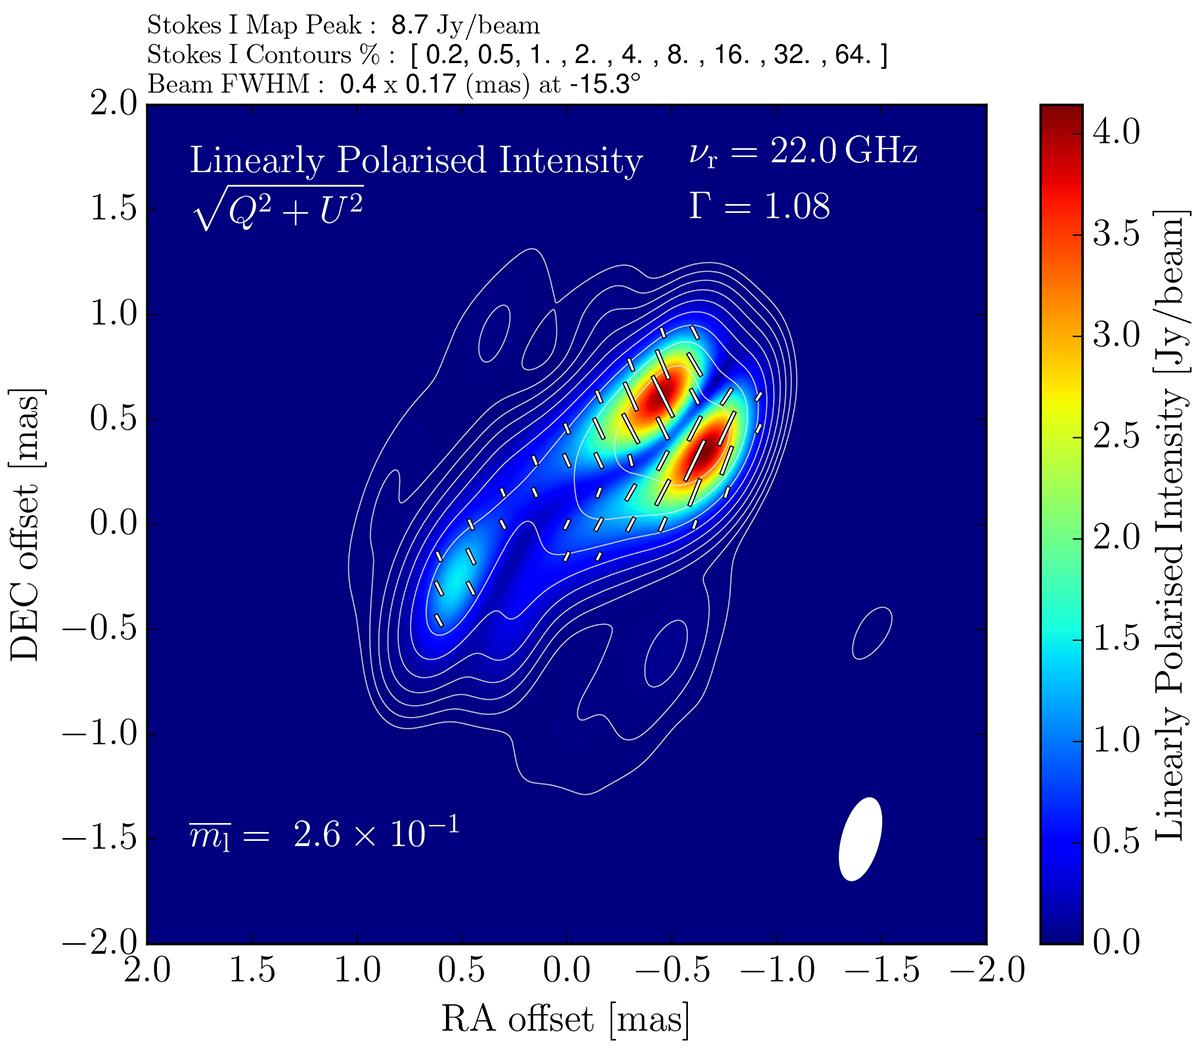
Results from RMHD simulations. A synthetic intensity map is shown of a ray-traced hybrid fluid-particle jet, moving from north-west to south-east, for a Γ = 1.08. The colour bar sets the linearly polarised intensity calculated from the Stokes Q and U parameters. The contours correspond to the total intensity flux density (Stokes I) and match those listed in Fig. 1. The image depicts the jet model as observed at a frequency of 22 GHz. The fractional linear polarisation (![]() ) level is indicated in the lower left corner. The convolving beam size (white ellipse, bottom right corner) equals the observational beam size.
) level is indicated in the lower left corner. The convolving beam size (white ellipse, bottom right corner) equals the observational beam size.
Current usage metrics show cumulative count of Article Views (full-text article views including HTML views, PDF and ePub downloads, according to the available data) and Abstracts Views on Vision4Press platform.
Data correspond to usage on the plateform after 2015. The current usage metrics is available 48-96 hours after online publication and is updated daily on week days.
Initial download of the metrics may take a while.