Open Access
Fig. B.3.
Download original image
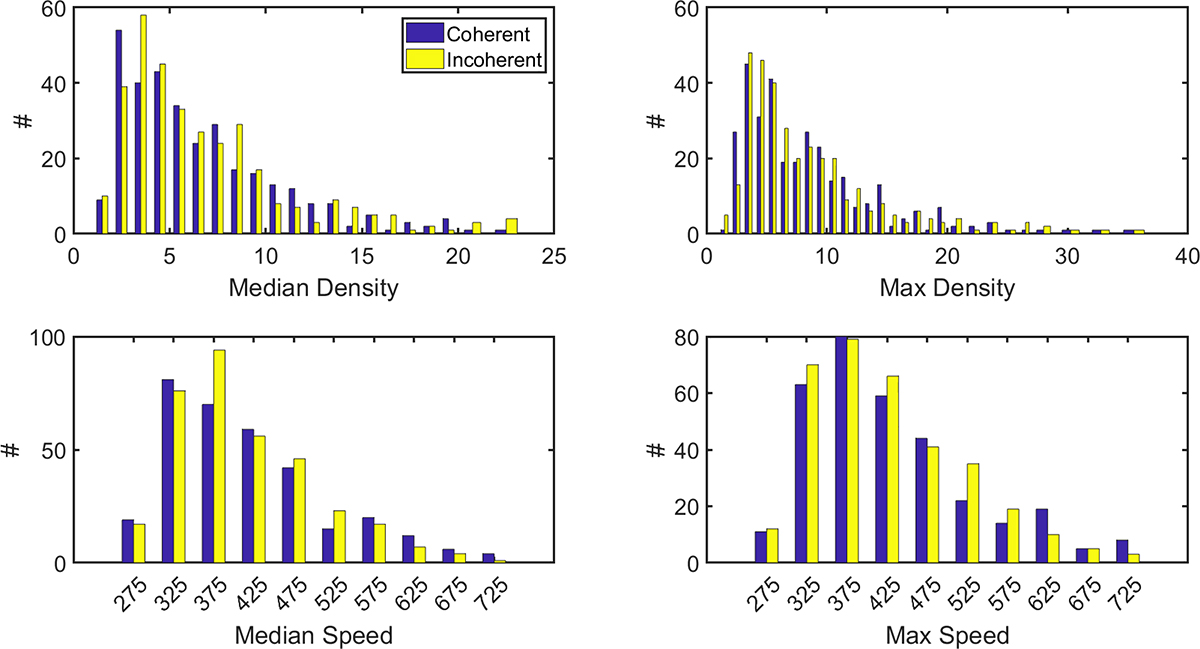
Distribution of PDS events with respect to the median and maximum proton density (top panels) and the median and maximum proton velocity (bottom panels). Coherent and incoherent PDS events are depicted with blue and yellow bars, respectively.
Current usage metrics show cumulative count of Article Views (full-text article views including HTML views, PDF and ePub downloads, according to the available data) and Abstracts Views on Vision4Press platform.
Data correspond to usage on the plateform after 2015. The current usage metrics is available 48-96 hours after online publication and is updated daily on week days.
Initial download of the metrics may take a while.