Open Access
Fig. 3.
Download original image
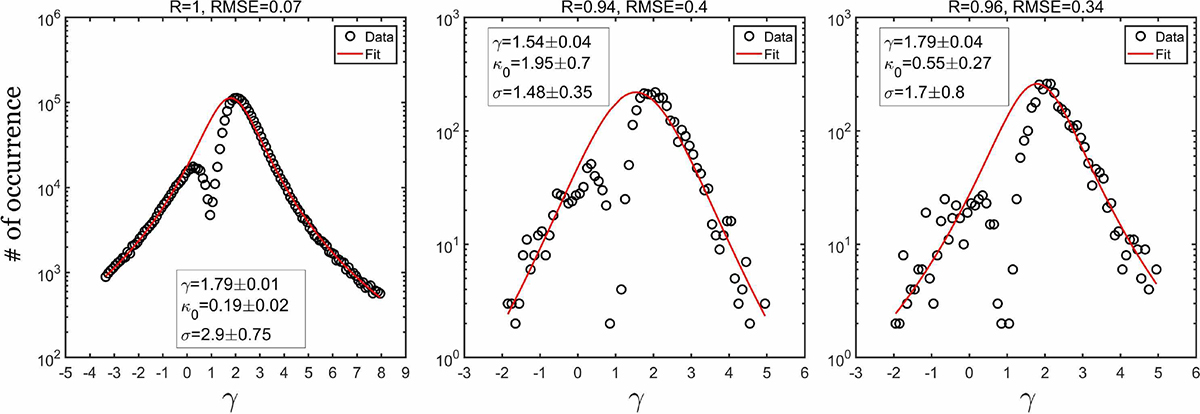
Distributions of γ for (left panel) the entire Wind dataset spanning 1995–2022, (middle panel) the 341 incoherent PDS events, and (right panel) the 330 coherent PDS events. The solid red lines correspond to the best-fit κ-Gaussian distribution using a weighted nonlinear fit.
Current usage metrics show cumulative count of Article Views (full-text article views including HTML views, PDF and ePub downloads, according to the available data) and Abstracts Views on Vision4Press platform.
Data correspond to usage on the plateform after 2015. The current usage metrics is available 48-96 hours after online publication and is updated daily on week days.
Initial download of the metrics may take a while.