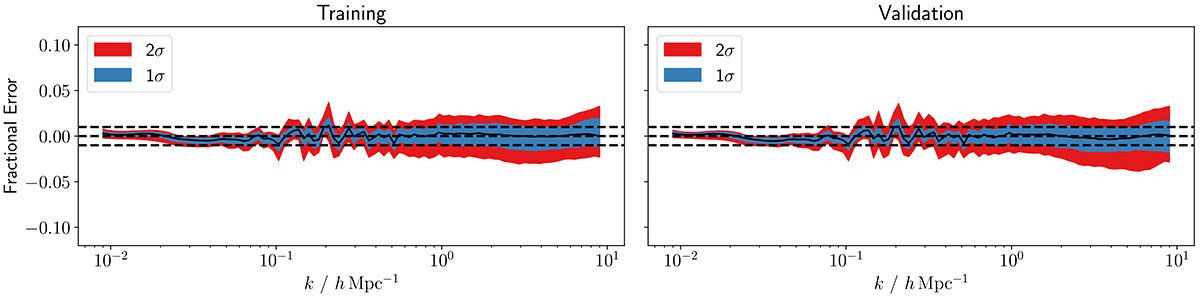
Fig. 5.
Download original image
Distribution of fractional differences between EUCLIDEMULATOR2 and the prediction from HALOFIT plus the correction given in Eq. (40) (SYREN-HALOFIT). For ease of comparison, the range of the y axis is the same as Fig. 3. The bands give the 1 and 2σ values, and we find that the root mean squared fractional error is 0.9% and 1.0% for training and validation, respectively.
Current usage metrics show cumulative count of Article Views (full-text article views including HTML views, PDF and ePub downloads, according to the available data) and Abstracts Views on Vision4Press platform.
Data correspond to usage on the plateform after 2015. The current usage metrics is available 48-96 hours after online publication and is updated daily on week days.
Initial download of the metrics may take a while.