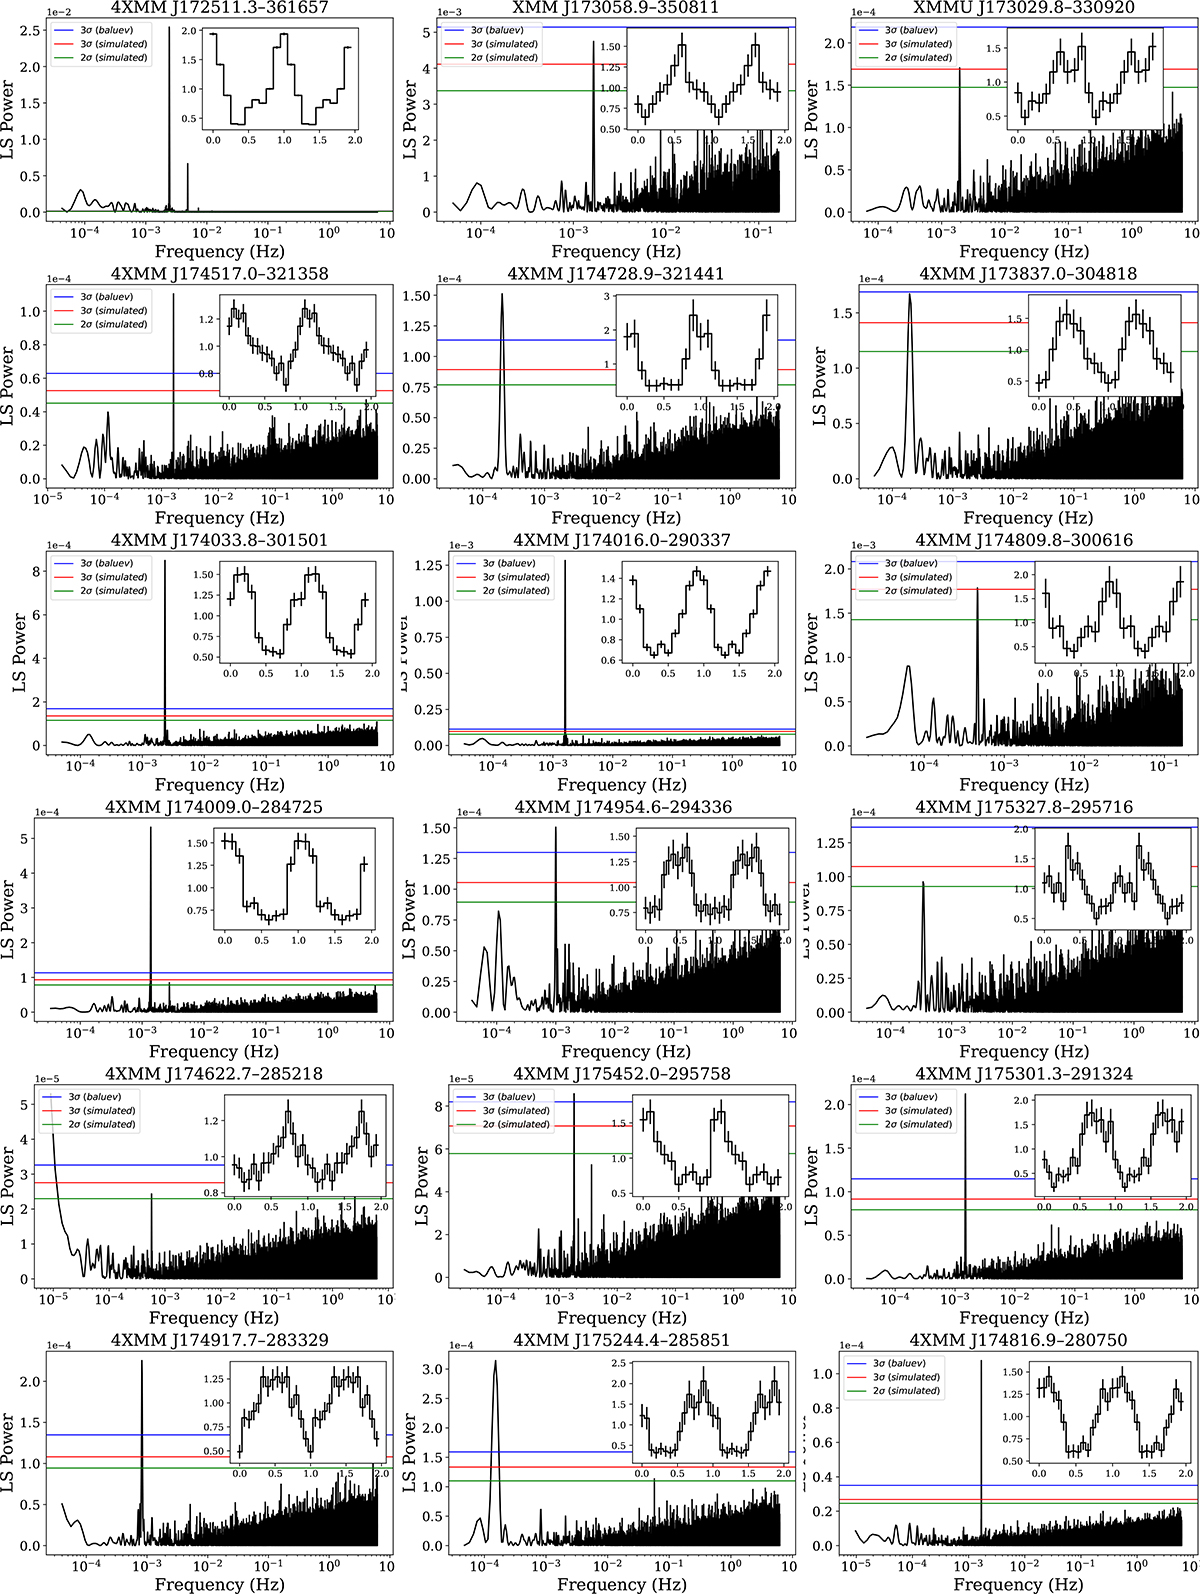
Fig. A.1.
Download original image
Lomb-Scargle periodogram of the sources listed in Table A.1. The periodograms are constructed using 2–10 keV EPIC-pn light curves. The horizontal green and red lines indicate the 2σ and 3σ confidence levels, respectively, computed from simulations, and the blue line indicates the false alarm probability (3σ confidence level) estimated from the analytical approximation from Baluev (2008). The small inset shows the folded light curve.
Current usage metrics show cumulative count of Article Views (full-text article views including HTML views, PDF and ePub downloads, according to the available data) and Abstracts Views on Vision4Press platform.
Data correspond to usage on the plateform after 2015. The current usage metrics is available 48-96 hours after online publication and is updated daily on week days.
Initial download of the metrics may take a while.