Open Access
Fig. A.3.
Download original image
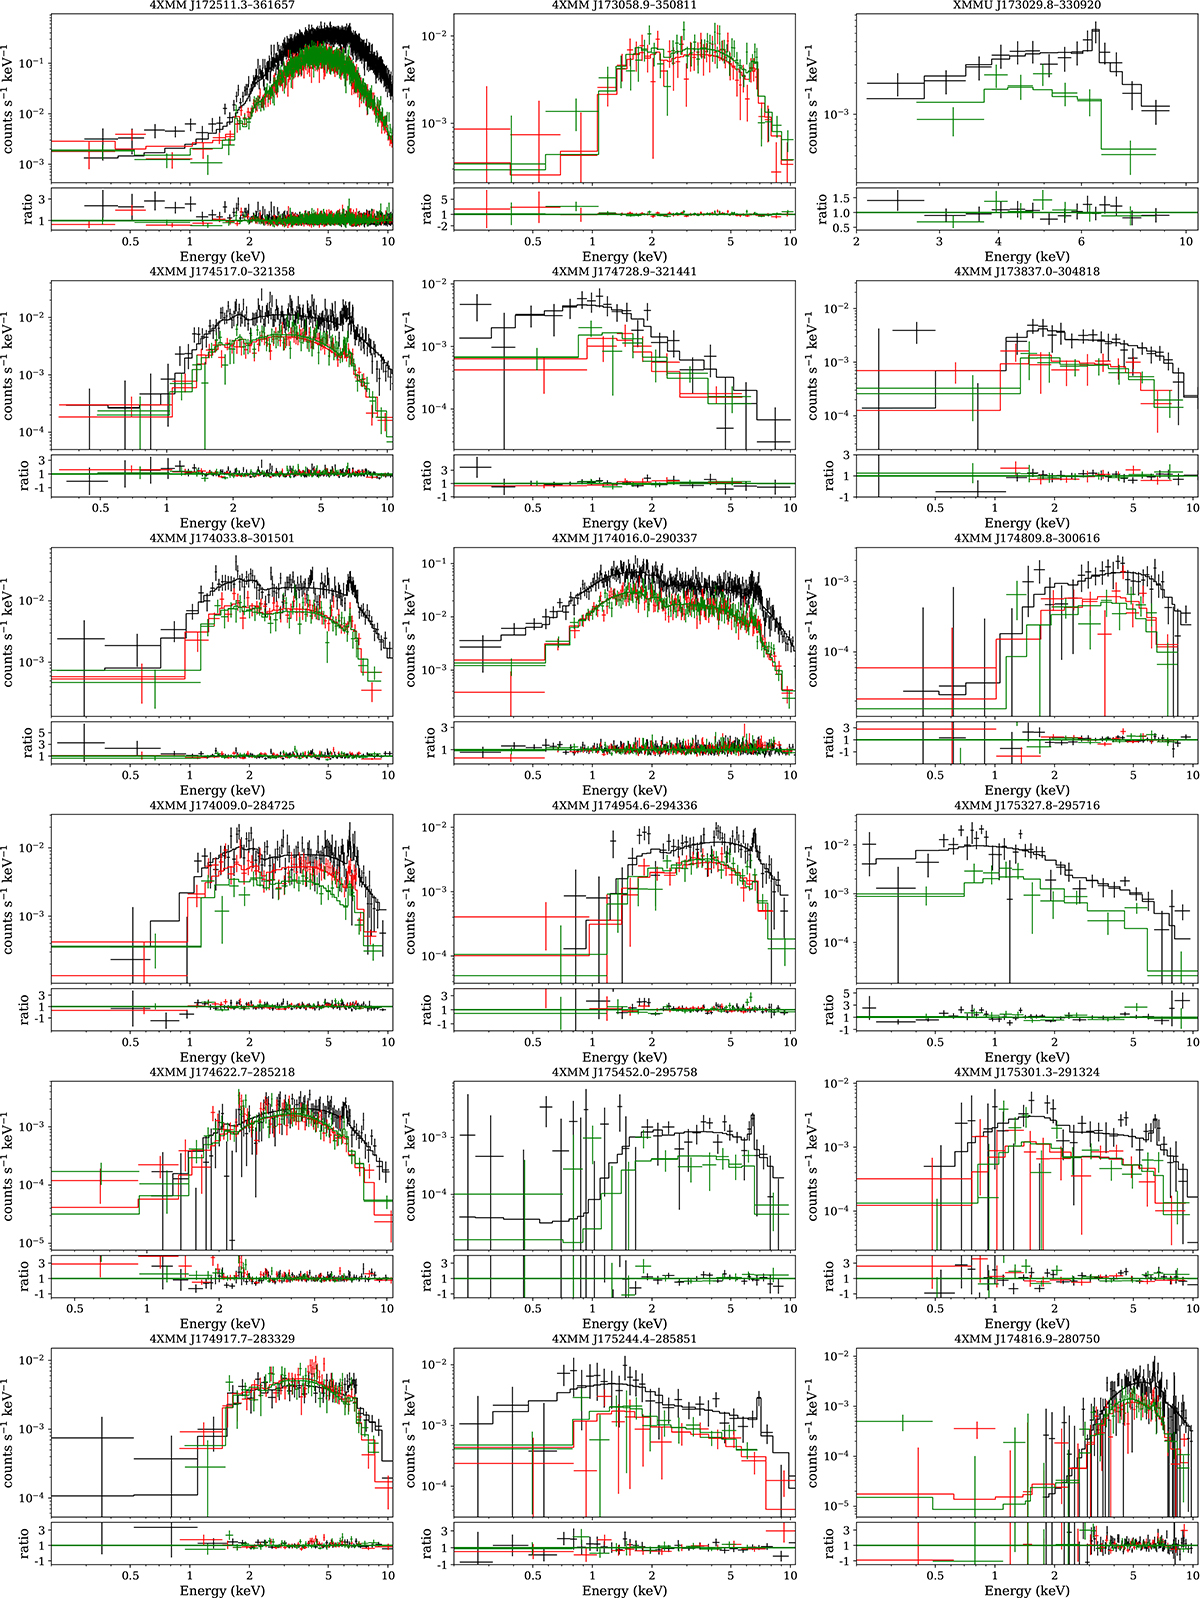
Spectral modeling of the sources in our sample using a model composed of tbabs*(power-law+g1+g2+g3). The g1,g2, and g3 represent three Gaussian lines, at 6.4, 6.7, and 6.9 keV, respectively. The black, red, and green colors represent data from the EPIC-pn, MOS1, and MOS2 detectors, respectively.
Current usage metrics show cumulative count of Article Views (full-text article views including HTML views, PDF and ePub downloads, according to the available data) and Abstracts Views on Vision4Press platform.
Data correspond to usage on the plateform after 2015. The current usage metrics is available 48-96 hours after online publication and is updated daily on week days.
Initial download of the metrics may take a while.