Open Access
Fig. 1.
Download original image
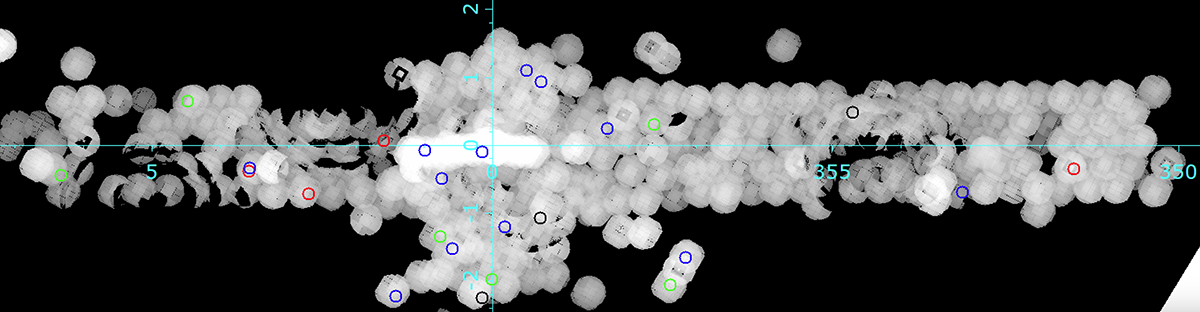
Mosaic of the exposure maps created using the ongoing XMM-Newton observations of the Galactic disk plus archival observations of the GC. The small red, blue, and green circles show the positions of confirmed or likely NSs, IPs, and polars, respectively. The black circles indicate the unclassified sources.
Current usage metrics show cumulative count of Article Views (full-text article views including HTML views, PDF and ePub downloads, according to the available data) and Abstracts Views on Vision4Press platform.
Data correspond to usage on the plateform after 2015. The current usage metrics is available 48-96 hours after online publication and is updated daily on week days.
Initial download of the metrics may take a while.