Fig. 9
Download original image
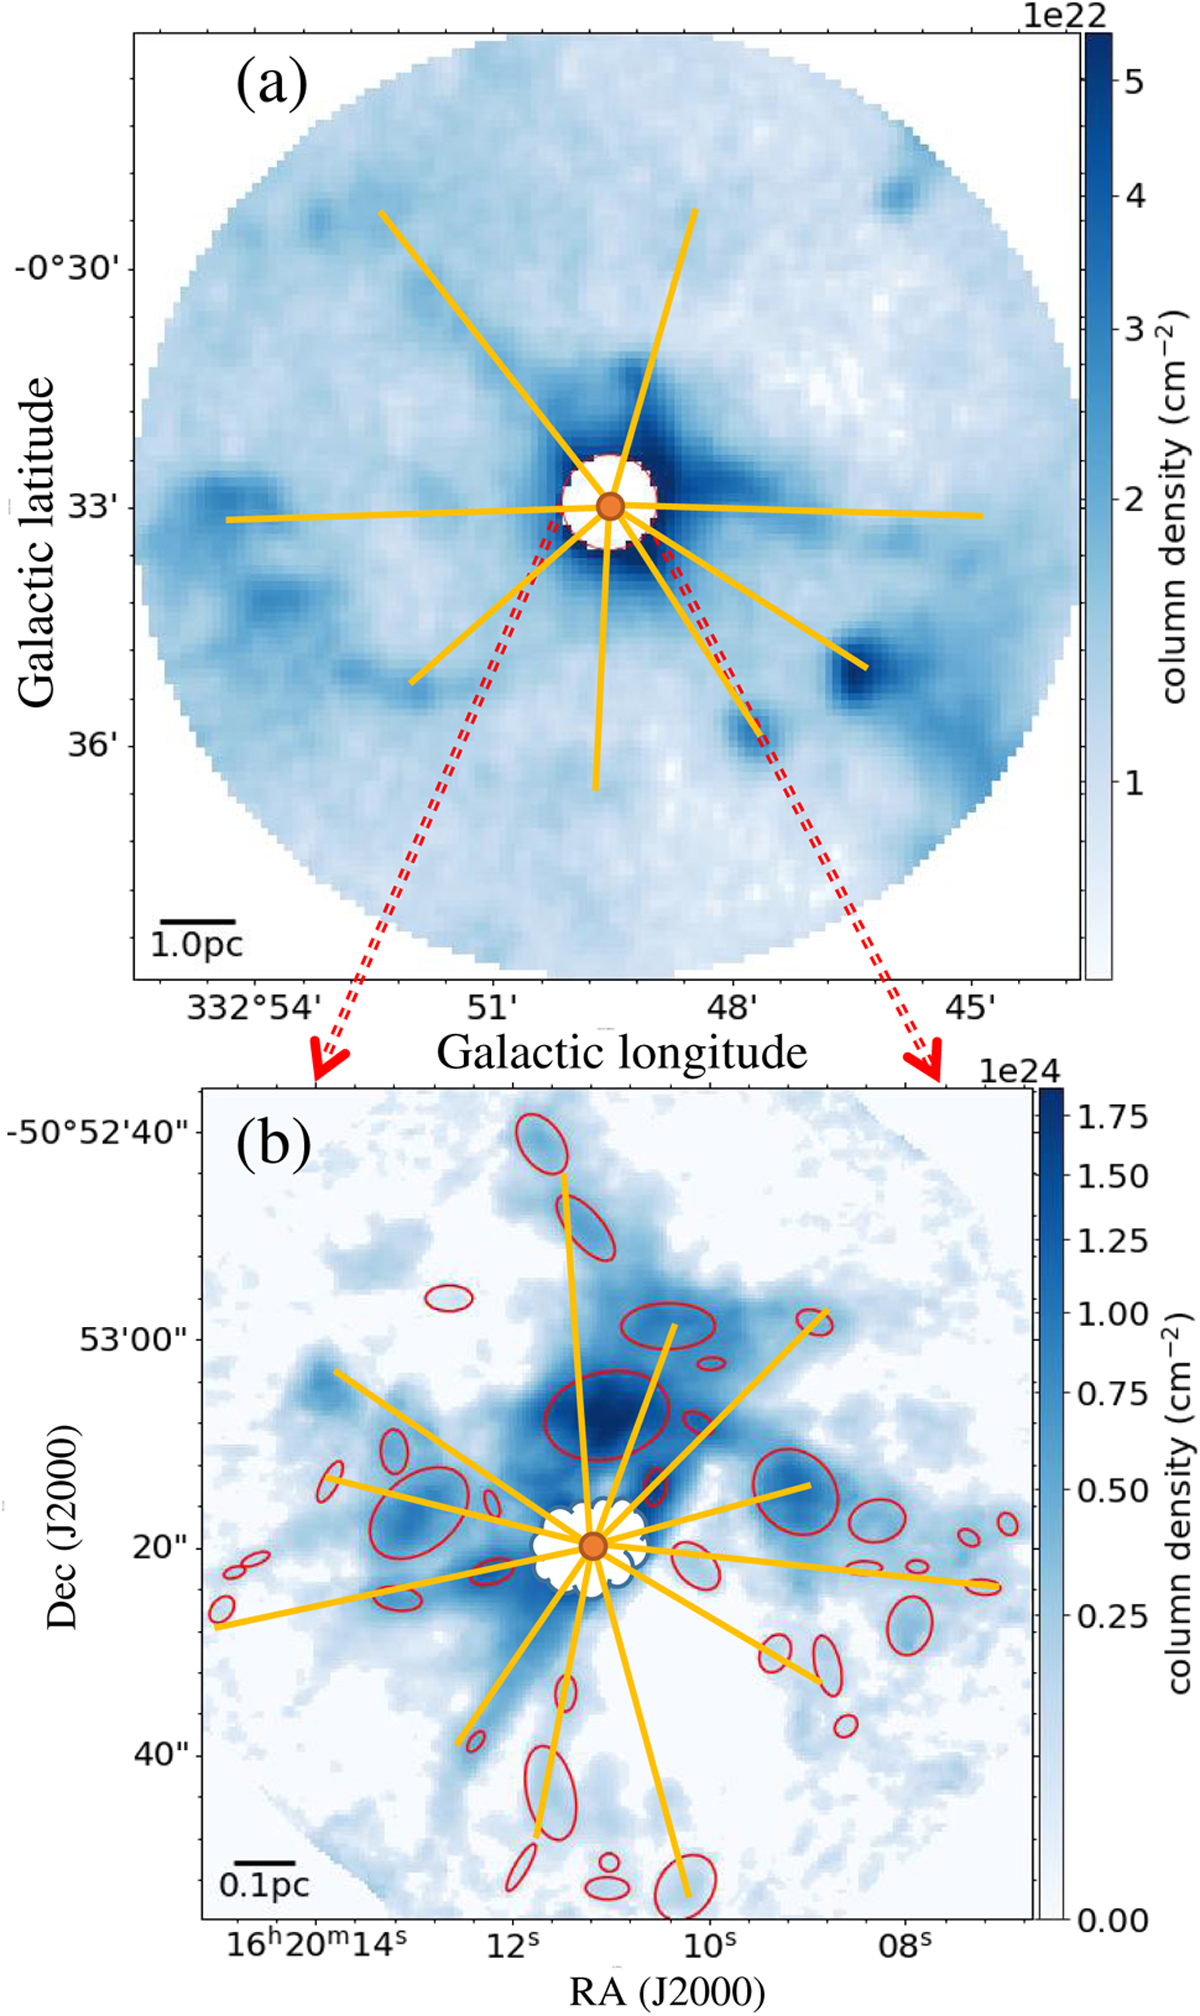
Computed structure first masked from the density map. The external tides from all outside material sustained by a point in the computed structure was calculated pixel by pixel and is illustrated by orange lines. (a) Background representing the column density map derived from ATLASGAL+Planck 870 µm data. The material in the FOV of the ALMA observation (white region) was masked. (b) Background representing the column density map derived from H13CO+ J = 1−0 and HCO+ J = 1−0 lines from the ALMA observation by the LTE analysis.
Current usage metrics show cumulative count of Article Views (full-text article views including HTML views, PDF and ePub downloads, according to the available data) and Abstracts Views on Vision4Press platform.
Data correspond to usage on the plateform after 2015. The current usage metrics is available 48-96 hours after online publication and is updated daily on week days.
Initial download of the metrics may take a while.