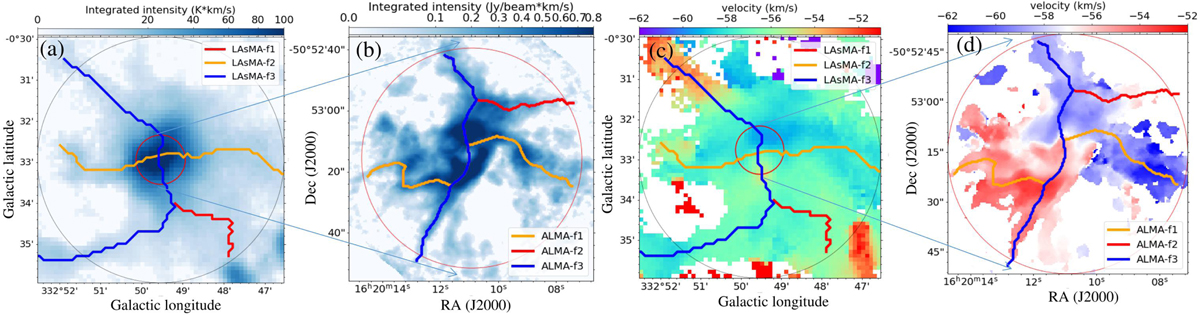
Fig. 2
Download original image
Hierarchical hub-filament structures in G332.83-0.55. (a) and (b) Moment 0 maps of LAsMA 13CO (3–2) and ALMA H13CO+ (1–0) emission. (c) and (d) Moment 1 maps of LAsMA13 CO (3–2) and ALMA H13CO+ (1–0) emission. The hub region marked by a red circle in panels a and c are enlarged in panels b and d. More detailed structures can be seen in panels b and d, thanks to the high resolution of ALMA observation. Lines in color present the filament skeletons identified by the FILFINDER algorithm.
Current usage metrics show cumulative count of Article Views (full-text article views including HTML views, PDF and ePub downloads, according to the available data) and Abstracts Views on Vision4Press platform.
Data correspond to usage on the plateform after 2015. The current usage metrics is available 48-96 hours after online publication and is updated daily on week days.
Initial download of the metrics may take a while.