Fig. 1
Download original image
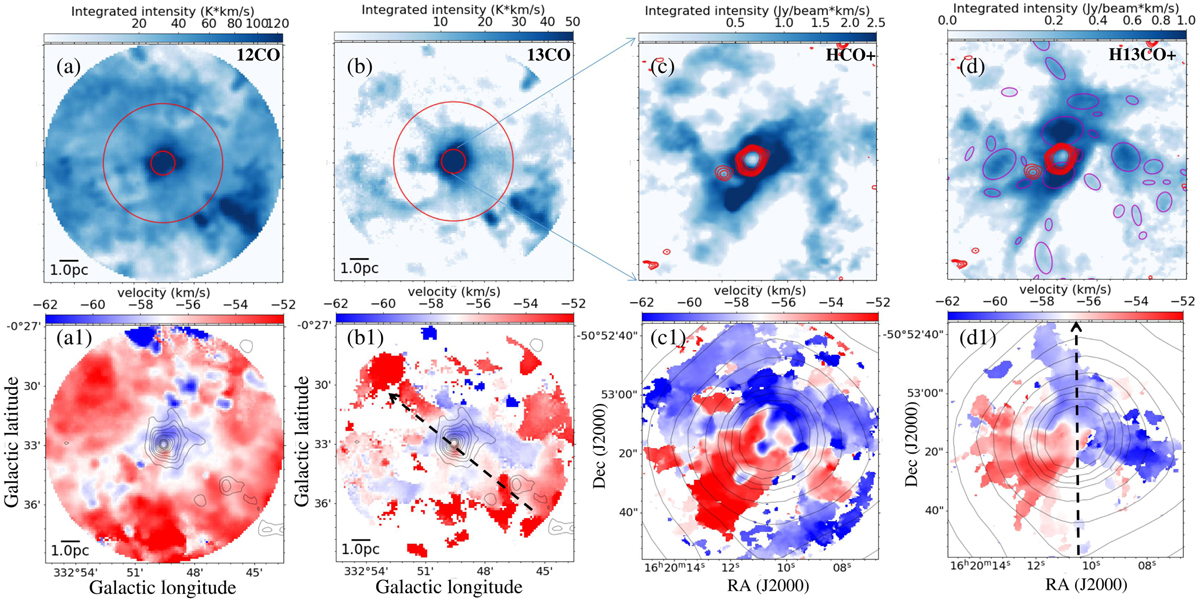
First and second columns: Moment maps of LAsMA 12CO (3–2) and 13CO (3–2) emission. The radius of the entire region is 0.1° (~6.28 pc). The big red circle marks the region with a 0.05° (~3.14 pc) radius, and the small red circle shows the region with a 0.01° (~0.63 pc) radius. Third and fourth columns: moment maps of ALMA 7 m+12 m HCO+ J = 1–0 and H13CO+ J = 1–0 emission. The radius of the entire region is 0.01° (~0.63 pc). Red contours in panels c and d show the 3 mm continuum emission. Black contours in the second row show ATLASGAL 870 µm continuum emission. Dashed black lines in panels b1 and d1 show the paths of the PV diagrams in Fig. 4. Ellipses in panel d represent the dendrogram structures identified in Sect. 3.3.
Current usage metrics show cumulative count of Article Views (full-text article views including HTML views, PDF and ePub downloads, according to the available data) and Abstracts Views on Vision4Press platform.
Data correspond to usage on the plateform after 2015. The current usage metrics is available 48-96 hours after online publication and is updated daily on week days.
Initial download of the metrics may take a while.