Fig. 6.
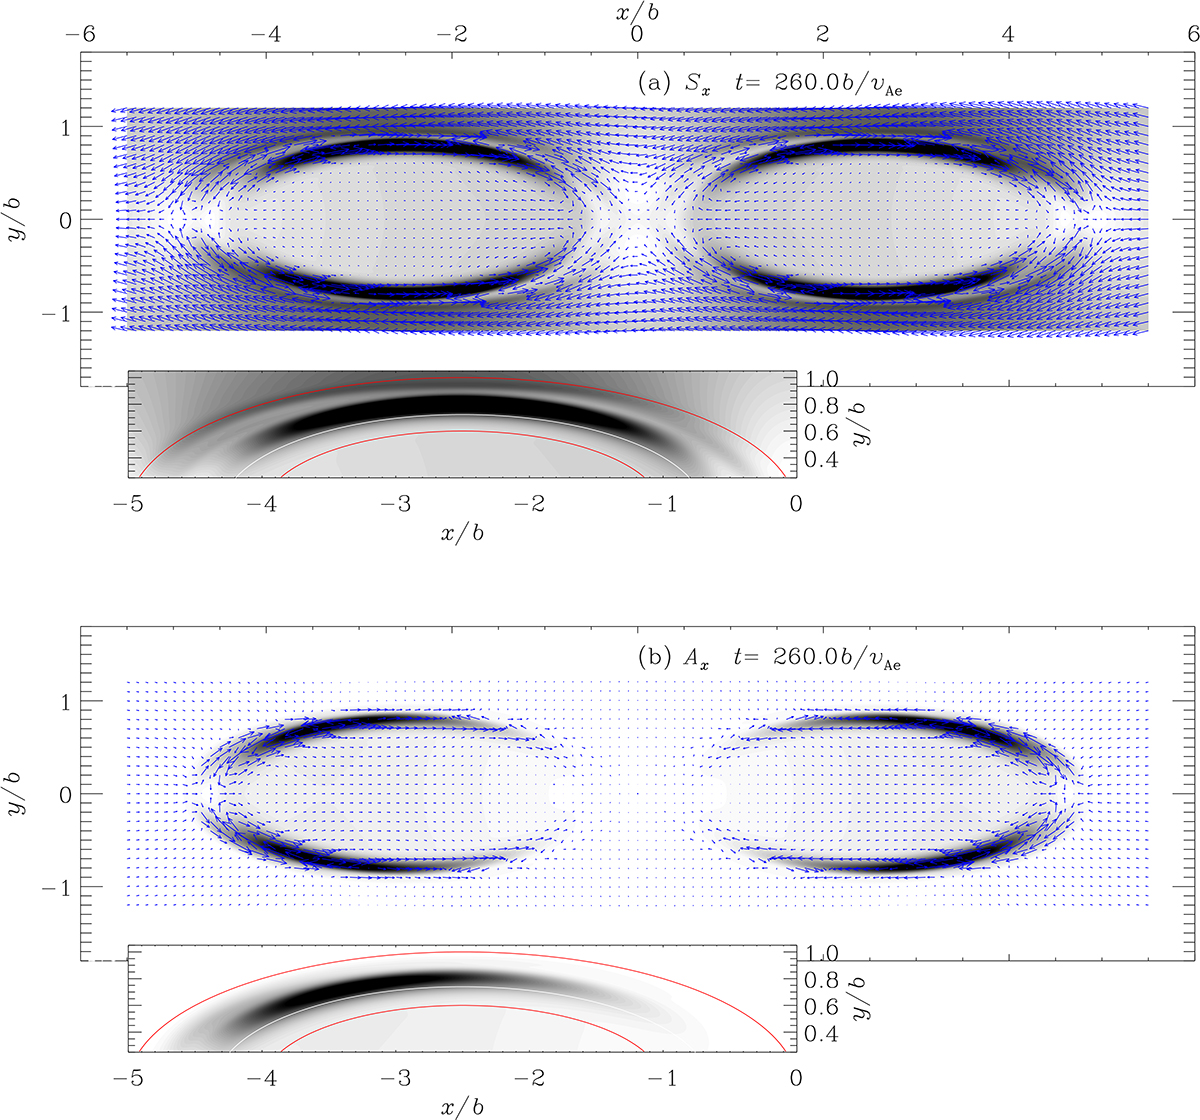
Download original image
Representative snapshots of the velocity field (the blue arrows) and energy density distribution (ϵ, filled contours) for (a) the Sx motion and (b) the Ax one in a two-elliptic-tube configuration with the x-major orientation. The inset in each panel emphasizes the distribution of ϵ in a representative nonuniform layer, whose boundaries are shown by the solid red curves. The white contour indicates where the Alfvén frequency, ωA = kvA, equals the quasi-mode frequency deduced with the fitting procedure. Both computations pertain to a fixed combination, ![]() . This snapshot is extracted from the animation available online. The ϵ contours in all snapshots are filled in such a way that darker portions correspond to larger ϵ. The blue arrows are also consistently scaled in all snapshots such that longer arrows correspond to stronger velocities.
. This snapshot is extracted from the animation available online. The ϵ contours in all snapshots are filled in such a way that darker portions correspond to larger ϵ. The blue arrows are also consistently scaled in all snapshots such that longer arrows correspond to stronger velocities.
Current usage metrics show cumulative count of Article Views (full-text article views including HTML views, PDF and ePub downloads, according to the available data) and Abstracts Views on Vision4Press platform.
Data correspond to usage on the plateform after 2015. The current usage metrics is available 48-96 hours after online publication and is updated daily on week days.
Initial download of the metrics may take a while.