Fig. 4.
Download original image
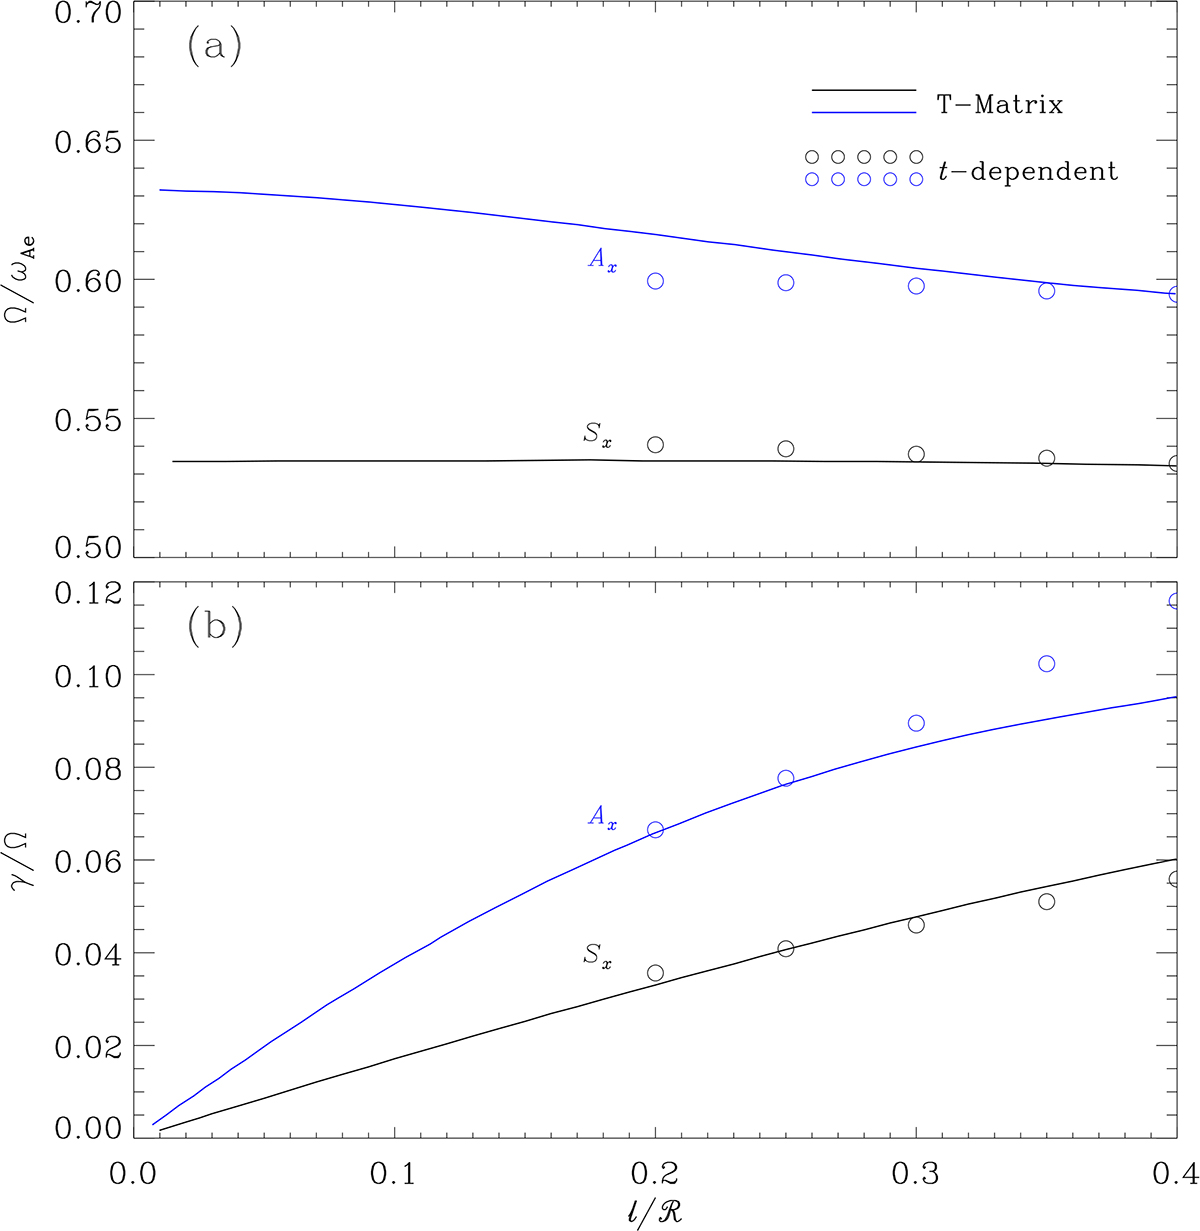
Comparison of (a) the oscillation frequencies, Ω, and (b) the damping rates, γ, of ideal quasi-modes deduced from time-dependent computations (the open circles) with those expected with the T-matrix formalism (solid lines). We depict the results for the Sx and Ax patterns with different colors. The T-matrix curves are taken from Fig. 4 of Soler & Luna (2015, SL15). Shown here is how Ω and γ/Ω depend on ℓ/ℛ, while the rest of the parameters are fixed at [ρi/ρe = 5, d/ℛ = 2.5, kb = π/30]. The [ℓ/ℛ, d/ℛ] notations follow from SL15 for ease of comparison.
Current usage metrics show cumulative count of Article Views (full-text article views including HTML views, PDF and ePub downloads, according to the available data) and Abstracts Views on Vision4Press platform.
Data correspond to usage on the plateform after 2015. The current usage metrics is available 48-96 hours after online publication and is updated daily on week days.
Initial download of the metrics may take a while.