Fig. 14
Download original image
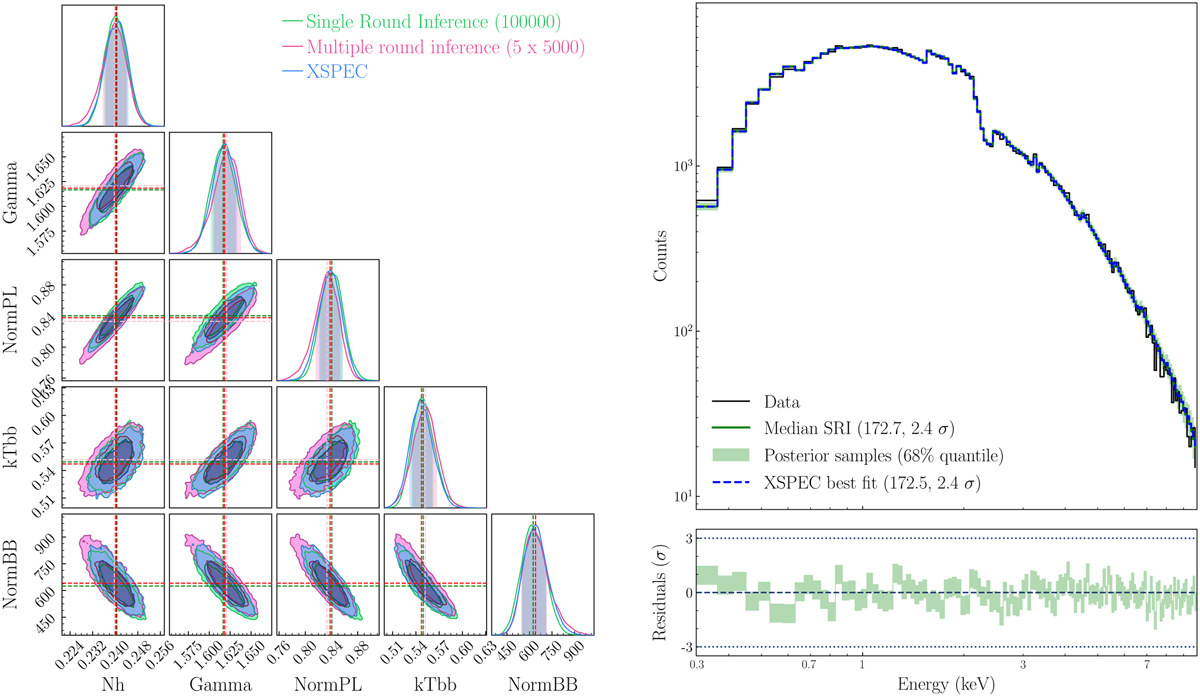
A comparison of the best-fit results derived from single-round, multiple-round inference and XSPEC. Left: posterior distribution comparison between XSPEC spectral fitting and SBI-NPE, as applied to the persistent emission spectrum of 4U1820-303 (pre-burst). The spectrum is modeled as tbabs*(blackbody+powerlaw). There is a perfect match between the three methods, not only on the best fit parameters, but also on the width of the posterior distributions. Right: count spectrum of the persistent emission, together with the folded model derived from both SBI-NPE and XSPEC. The C-STAR of the best fit is indicated together with its deviation against the expected value.
Current usage metrics show cumulative count of Article Views (full-text article views including HTML views, PDF and ePub downloads, according to the available data) and Abstracts Views on Vision4Press platform.
Data correspond to usage on the plateform after 2015. The current usage metrics is available 48-96 hours after online publication and is updated daily on week days.
Initial download of the metrics may take a while.