| Issue |
A&A
Volume 686, June 2024
|
|
|---|---|---|
| Article Number | A98 | |
| Number of page(s) | 16 | |
| Section | Extragalactic astronomy | |
| DOI | https://doi.org/10.1051/0004-6361/202449191 | |
| Published online | 03 June 2024 | |
BANG-MaNGA: A census of kinematic discs and bulges across mass and star formation in the local Universe
1
DiSAT, Università degli Studi dell’Insubria, Via Valleggio 11, 22100 Como, Italy
2
INAF – Osservatorio Astronomico di Brera, Via Brera 20, 20121 Milano, Italy
e-mail: This email address is being protected from spambots. You need JavaScript enabled to view it.
3
INFN, Sezione di Milano-Bicocca, Piazza della Scienza 3, 20126 Milano, Italy
4
Università degli Studi di Milano-Bicocca, Piazza della Scienza 3, 20126 Milano, Italy
5
International Centre for Radio Astronomy Research, The University of Western Australia, Crawley, WA 6009, Australia
6
ARC Centre of Excellence for All Sky Astrophysics in 3 Dimensions (ASTRO 3D), Australia
7
European Southern Observatory, Karl-Schwarzschild-Straße 2, 85748 Garching, Germany
Received:
9
January
2024
Accepted:
14
March
2024
Abstract
In this work, we aim to quantify the relevance of kinematically identified bulges and discs and their role in the process of galaxy quenching. To achieve this, we utilised an analysis of the SDSS-MaNGA survey conducted with the GPU-based code BANG which simultaneously models galaxy photometry and kinematics to decompose galaxies into their structural components. We found that below M⋆ ≃ 1011 M⊙, galaxies span a wide range in their dynamical properties. The overall dynamical state of a galaxy is determined by the relative prominence of a dispersion-supported inner region and a rotationally supported disc. Our decomposition reveals a natural separation between these classes, with only a minor fraction of stellar mass retained by structures exhibiting intermediate dynamical support. When examining galaxies in terms of their star formation activity, an apparent substantial decrease in rotational support is observed as they move below the star-forming main sequence. This behaviour is particularly evident when using luminosity-weighted tracers of kinematics, while it almost vanishes with mass-weighted tracers. Luminosity-weighted quantities not only capture differences in kinematics but also in the stellar population, potentially leading to biased interpretations of galaxy dynamical properties and quenching. Our findings indicate that quenching implies almost no any structural transformation in galaxies below M⋆ ≃ 1011 M⊙. Processes such as disc fading are more likely explanations for the observed differences in mass-weighted and luminosity-weighted galaxy properties. When the galactic disc ceases star formation, its mass-to-light ratio does indeed increase without any significant morphological transformation. The picture is remarkably different above M⋆ ≃ 1011 M⊙. In this case, regardless of the tracer used, a substantial increase in galaxy dispersion support is observed along with a significant structural change. A different quenching mechanism, most likely associated with mergers, dominates. Notably, this mechanism is confined to a very limited range of high masses.
Key words: galaxies: bulges / galaxies: kinematics and dynamics / galaxies: photometry / galaxies: star formation / galaxies: statistics / galaxies: structure
© The Authors 2024
 Open Access article, published by EDP Sciences, under the terms of the Creative Commons Attribution License (https://creativecommons.org/licenses/by/4.0), which permits unrestricted use, distribution, and reproduction in any medium, provided the original work is properly cited.
This article is published in open access under the Subscribe to Open model. This email address is being protected from spambots. You need JavaScript enabled to view it. to support open access publication.
1. Introduction
The morphological complexity of galaxies in the local Universe exemplified by the Hubble tuning fork (Hubble 1926), in addition to the strong correlation between morphology and other galaxy properties such as star formation, mass, and kinematics (Cappellari et al. 2011; Kormendy & Bender 2012), suggest that galaxies do grow following a variety of evolutionary pathways. Multiple solutions have been proposed to shed light on the main formation mechanisms in shaping local galaxies with a lot of attention being given to techniques able to separate galaxies into different structural components identified from 2D imaging (i.e. photometrically identified bulges, spheroid, and discs, Peng et al. 2002; Gadotti 2009; Simard et al. 2011; Lange et al. 2016). The preliminary studies about the relative importance of bulges and discs lead to the formulation of the “two phases” evolutionary framework (Oser et al. 2010; Driver et al. 2013). In this commonly accepted scenario, bulges are the result of violent and rapid processes that happened relatively early in the Universe, while discs are the result of accretion and cooling of gas conserving angular momentum (Fall & Efstathiou 1980). Moreover, galaxies in high-mass halos tend to build most of their mass “ex situ” with little ongoing star formation at low redshift. In contrast, in the lower-mass regimes, “in situ” star formation is still present even at later stages. In principle, a “classical bulge” should be defined as the central galaxy component that has formed at early times as a result of violent processes. In practice, since it is impossible to know exactly the galaxy evolution history, this definition is never adopted. From here on, as we state again in Sect. 2, we refer to dispersion-supported bulges as the galaxy light component that is spherically symmetric, non-rotating, and isotropic1.
Addressing the relative importance of bulges and discs in the local Universe is crucial for understanding the most relevant mechanism in forming galaxies. Results coming from different, purely photometric, decomposition approaches broadly agree, equally splitting stellar mass into the bulge+spheroid and disc components (Moffett et al. 2016; Thanjavur et al. 2016; Bellstedt et al. 2024), with spheroidal galaxies being the dominant class above M⋆ ≃ 1011 M⊙, contributing up to 80–100% of the total mass budget. Even though these results may hint at a Universe in which mergers play a prominent role (van Dokkum et al. 2010; López-Sanjuan et al. 2012), possible biases may exist. For instance, purely photometric decomposition approaches struggle in disentangling between nearly face-on dynamically cold discs and a purely triaxial spheroid. Additionally, it has been shown that the commonly adopted definition of photometric bulges (i.e. “the central light component that is in excess of the inward extrapolation of an exponential fit to the disc brightness profile”, Kormendy & Kennicutt 2004) may result in the inclusion of structures (i.e. nuclear disc, inner bars, pseudobulges) shaped by secular evolution processes (Erwin et al. 2015, 2021; Gadotti et al. 2020). In this regard, recent progress has been made through integral field spectroscopy (IFS) surveys, which have allowed us to classify galaxies according to their rotational-to-dispersion velocity ratio (Cappellari et al. 2007), showing that dispersion-dominated systems (or slow rotators) minimally contribute to the global mass budget in the local Universe (van de Sande et al. 2017; Guo et al. 2020).
In this regard, the galaxy decomposition problem has also been approached from an IFS perspective. This has been done either by slicing datacubes into several narrow bands and applying bulge+disc decomposition on them (Johnston et al. 2017; Méndez-Abreu et al. 2019) or by assuming a photometric decomposition and extracting the bulge and disc spectra directly from the datacubes (Oh et al. 2016; Tabor et al. 2017, 2019; Pak et al. 2021). These methods mostly focus on characterising the stellar population and the star formation histories of bulges and discs without aiming at any dynamical models of the galaxy. An alternative approach is to model the galaxy surface brightness and its line-of-sight kinematics as the superposition of purposely weighted orbital families (Schwarzschild 1979). In this case, galaxies are characterised in terms of their angular momentum ex post the fit without explicitly discriminating between bulges and discs. Without a doubt, it is clear that linking the visual morphology to the galactic stellar orbital distribution is not straightforward (Zhu et al. 2018a; Fraser-McKelvie & Cortese 2022).
A proper characterisation of the galaxy structure becomes even more important when we are interested in linking the morphology to the current star formation rate (SFR). It is generally assumed that the bimodality in SFRs (Brinchmann et al. 2004) is closely linked to the structural and morphological properties of galaxies. This comes from the evidence that star formation mostly happens in disc-like galaxies, while spheroids and bulge-dominated galaxies are almost always quiescent.
This oversimplified picture would suggest that the processes involved in quenching galaxies (i.e. shutting their star formation off) and changing their morphology (from a disc-like to a spheroidal shape) are closely related and may even act on similar timescales. However, the existence of a significant population of passive, rotationally dominated, disc galaxies has shown how this picture is too simplistic and that quenching may not necessarily imply morphological transformation. (e.g. Blanton et al. 2005; Cortese & Hughes 2009; Woo et al. 2017; Rizzo et al. 2018; Fraser-McKelvie et al. 2021; Cortese et al. 2022). In the case of dissipationless (i.e. dry) major mergers, a significant alteration of the galaxy morphology towards a spheroidal shape is indeed expected (Cox et al. 2006). Although, in the presence of gas a disc can be reformed after the merger. Similarly, it is argued that the growth of a central spheroidal structure can stabilise the gas disc preventing further fragmentation, star formation and quenching the galaxy (Martig et al. 2009)2. However, such a mechanism implies the existence of passive, bulge-dominated galaxies surrounded by large gaseous discs, although such a population have not been, so far, observed. An apparent growth of a bulge related to the halting of star formation can be explained as a disc fading (Croom et al. 2021). In this case, the galactic disc ceases star formation and dims, artificially boosting the galaxy bulge-to-total ratio.
In Rigamonti et al. (2022a), hereafter Paper I, we presented BANG3, a code purposely designed for a simultaneous and self-consistent bulge+disc decomposition of galaxy photometry and kinematics. Being informed by the kinematics BANG’s decomposition suffers minimally from the possible biases of purely photometric decomposition. BANG bases its parameter estimation on a robust Bayesian algorithm (i.e. nested sampling Skilling 2004) combined with a GPU parallelisation strategy for high computational performance, representing an optimal tool for automated analysis on large galaxy samples. This allowed us to present the first morpho-kinematic bulge+disc decomposition obtained through galaxy dynamical models (Rigamonti et al. 2023, hereinafter Paper II) of the largest, to date, IFS survey (i.e. the Mapping Nearby Galaxies at Apache Point Observatory, MaNGA, survey Bundy et al. 2015).
In the present study, starting from the analysis of Paper II, we aim at characterising the mass budget of dispersion-supported bulges and discs with a particular emphasis on their kinematic state. Furthermore by characterising the global kinematic state of each galaxy, we will measure the relative importance of dispersion-dominated and rotationally dominated galaxies demonstrating that the inclusion of kinematics in the analysis together with proper dynamical modelling of galaxies is critical to reduce the biases present in purely photometry-based approaches. In addition, by including SFRs in our analysis, we will show how luminosity-weighted quantities may lead to improper conclusions on the importance of morphological transformation during the quenching phase of galaxies. Indeed, our results hint at a morphological transformation almost not happening during quenching (at least below M⋆ ≃ 1011 M⊙) suggesting that processes such as bulge growth may not be the main cause of halting galaxies star formation.
This paper is organised as follows. In Sect. 2 we briefly set out the sample and the parameter catalogue we consider in this analysis together with a brief summary of our modelling approach. Sect. 3 discusses in detail the role of some parameters that play a key role in the analysis of galaxies mass budget which is presented in Sect. 4. Sects. 5 and 6 are devoted to a discussion and a summary of the interpretations and implications of our results. Throughout this paper, we use a flat Λ cold dark matter cosmology: H0 = 70 km s−1 Mpc−1, ΩM = 0.3, and ΩΛ = 0.7.
2. Data sample and parameters
2.1. Photometry and kinematics
This study is based on a morpho-kinematic dataset built upon the SDSS imaging survey (Gunn et al. 2006) and the final release of the MaNGA survey from the Seventeenth Data Release (DR17, Abdurro’uf et al. 2022) of the fourth phase of the Sloan Digital Sky Survey (SDSS-IV, Blanton et al. 2017). The MaNGA survey (Bundy et al. 2015; Drory et al. 2015) has collected integral field spectroscopic measurements for ≃10 000 local galaxies selected to have a roughly flat log stellar mass distribution above 109 M⊙ in the redshift range 0.01 < z < 0.15. In this work, we use line-of-sight (l.o.s.) stellar velocity and velocity dispersion estimates and their associated errors as provided by the data analysis pipeline (DAP, Westfall et al. 2019) assuming the same native spatial binning as for the data cube. On top of that, we collected SDSS i and g band surface brightness maps and cropped them to the same spatial extent as the MaNGA data.
2.2. Sample selection and volume weights
Similarly to what was done in Paper II we carefully selected, for the forthcoming analysis, a subset of ≃5000 galaxies from the originally analysed MaNGA sample. Specifically, we discarded all galaxies with log10M⋆ < 9.5 as the stellar velocity dispersion is generally smaller than the instrumental velocity dispersion and those with bulge half-mass radius smaller (within its error) than the pixel size4. We also visually inspected and discarded all the objects showing evidence of ongoing mergers or other contaminants (i.e. wrong redshift, central non-masked stars and type I AGN). We cross-matched our sample with the catalogue presented in Fraser-McKelvie & Cortese (2022) whose SFR measures have been collected from the GALEX-Sloan-WISE Legacy Catalogue 2 (GSWLC-2 Salim et al. 2016, 2018), obtaining a final sample of 4731 galaxies.
The MaNGA stellar mass distribution is roughly flat above 109 M⊙ which means that galaxies at high stellar masses are oversampled compared to the galaxy stellar mass distribution observed in the local Universe. For this reason, a volume weight is assigned to each MaNGA galaxy (Wake et al. 2017) to return the original sample to a volume-limited equivalent. Given that we limit our analysis to a subsample of the original MaNGA catalogue, we calculated corrected volume weights based on the fraction of galaxies in our sample with respect to the complete sample for each stellar mass and redshift bin (see Fraser-McKelvie & Cortese 2022, for further details).
2.3. Model summary and parameter catalogue
Throughout this paper we use the result of the analysis carried out in Paper II, we summarise in what follows the main assumption underlying our modelling strategy, we refer to Paper I and Paper II for a detailed discussion on the modelling approach.
Each galaxy is assumed to be axially symmetric described as the superposition of a spherical bulge, two exponential razor-thin discs and a dark-matter halo. The galaxy position and orientation are characterised by the centre (x0, y0), the position angle (PA) and the inclination i. Those are free parameters of the model and are estimated to provide the best projection of the galaxy onto the sky plane.
Each galaxy component is described through the following potential-density profiles:
– the spherically symmetric and isotropic bulge is described by a Dehnen profile (Dehnen 1993) and parameterised in terms of its mass, scale radius and inner density slope (respectively Mb, Rb and γ). The volume density and mean velocity dispersion of the bulge are projected to provide the bulge surface density and line-of-sight (l.o.s.) velocity dispersion. The surface density is then converted into surface brightness through the bulge mass-to-light ratio (M/Lb). Throughout the paper, we refer to this component as “dispersion-supported bulge” because it is identified as a non-rotating, isotropic and spherically symmetric component;
– two (i.e. “inner” and “outer”) axially symmetric components are described by exponential razor-thin profiles characterised in terms of their masses (Md, 1, Md, 2), scale radii (Rd, 1, Rd, 2) and two further parameters for describing their kinematical state (k1, k2). More precisely, we approximate the intrinsic velocity dispersion and the tangential velocity of the inner (outer) disc assuming that a fraction k1 (k2) of the total kinetic energy is in ordered bulk motion and the rest goes into an isotropic velocity dispersion component. The discs surface density is converted into surface brightness through the disc mass-to-light ratios (M/Ld, 1, M/Ld, 2). All these quantities are then projected along the l.o.s.. we note that, the “kinematic decomposition parameters” (k1 and k2) are free parameters of the model whose value ranges from 0 for a dispersion-supported regime to 1 for a rotation-supported regime. The freedom given to the inner and the outer disc to be either dispersion-supported or rotationally supported allows us to model a variety of structures present in galaxies resulting in multiple possible interpretations of the inner and the outer “disc natures” (see Sect. 3 for a detailed discussion);
– the Navarro–Frenk–White (Navarro et al. 1996) dark matter halo parameterised in terms of the halo-to-stellar mass fraction and the halo concentration (respectively f⋆ and c). It is the only dark component in our model contributing to the overall potential. We note that, given the limited spatial extension of the MaNGA data, only the mass within the observed kinematics can be robustly recovered. Indeed, as a more conservative approach, for this analysis, we considered the parameters estimated in the “halo-fixed” configuration (see Paper II for further details);
The total surface brightness of a galaxy model is the sum of the surface brightness of each visible component. The total l.o.s. velocity and l.o.s. velocity dispersion are determined as a brightness-weighted average of each component contributions5 while the average mass-to-light ratio is defined as the fraction between the total surface density and the total surface brightness. We note that since every component depends on its own mass-to-light ratio the average mass-to-light ratio will not be radially constant.
We refer to Table 1 for a summary of all the model parameters together with a brief description. All the free parameters of the model are determined by fitting simultaneously the brightness, kinematics and mass-to-light ratio data with a nested sampling algorithm (Skilling 2004). The model evaluation is performed on GPUs. For each galaxy, models with a different number of visible components are compared with each other. The best model is chosen to be the one with the highest Bayesian evidence.
Summary of the model parameters.
3. Kinematics of the whole galaxies and of their components
In this section, we aim to clarify the meaning of the k1 and k2 parameters and to define new parameters of crucial relevance in the forthcoming analysis.
The left and middle panels of Fig. 1 show the distribution of the k1 and the k2 parameters in our sample. Focusing on the left panel we see a clear peak in the histogram for k1 ≲ 0.1 while the distribution is almost flat for higher values. When k1 is close to zero the inner disc models a dispersion component in the galaxy centre which may be exponential in its light profile or, more often, not axi-symmetric when projected along the l.o.s.; in these cases, the inner disc is providing a correction to the dispersion-supported bulge. We note that a non-negligible amount of galaxies have intermediate values of k1. This is not surprising since structures such as thick discs, pseudobulges and bars are common in disc-like galaxies resulting in galaxies with intermediate rotational support (Fraser-McKelvie & Cortese 2022). Unfortunately, given the simplicity of our current model, it is still not possible to clearly distinguish among these structures. The middle panel of Fig. 1 shows a bimodality in the distribution of k2; this reflects, to some extent, the bimodality between rotating discs and pressure-supported ellipticals. When k2 is close to one (≳0.6) the outer disc models the large-scale rotating disc of the galaxy; on the contrary, when k2 is close to zero (≲0.10), in the majority of the cases (we discuss some exceptions in Appendix C), the galaxy is a fully dispersion-supported system (i.e. a genuine elliptical). The right panel of Fig. 1 shows the distribution of the klum (in turquoise) and kmass (in dark green) which are the luminosity-weighted and the mass-weighted average of the k1 and k2 parameters respectively defined as:
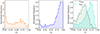 |
Fig. 1. Distribution of the kinematic parameters. From left to right: normalised volume-weighted distributions of the k1, k2, klum (in turquoise), and kmass (in dark green) parameters. See Eqs. (1) and (2) for the definitions of klum and kmass. |
 (1)
(1)
 (2)
(2)
where Lj = Mj/(M/L)j with j = {b; d, 1; d, 2} is the luminosity of the j-th component obtained dividing the mass Mj of the j-th component by its mass-to-light ratio ((M/L)j)6. klum (kmass), being the luminosity (mass) -weighted average of k1 and k2 among all the components, quantifies the dynamical state of the galaxy as a whole7. It is important to note that the meaning of this parameter is different from k1 and k2. While k1 and k2 are related to the kinematics of individual galaxy components, preserving information about the galaxy structure, klum and kmass characterise the overall kinematic state of the entire galaxy. Therefore, it is not unexpected to encounter galaxies with different k1 or k2 parameters and yet similar klum or kmass, due to the differing relative importance of each galaxy component. The distribution of klum (third panel, turquoise colour in Fig. 1) shows a clear peak close to klum ≃ 0.75 corresponding to fast-rotating galaxies with a flattening towards klum ≃ 0. Interestingly, the peak at zero, present both in the k1 and k2 distributions, disappears. This is because the majority of the galaxies with an inner dispersion-dominated component (i.e. k1 ≃ 0) when analysed as a whole, demonstrate clear rotation, with the outer disc retaining most of the angular momentum of the galaxy and harbouring a significant fraction of the mass/light of the system. Slow-rotating galaxies (i.e. k1 ≃ 0 and k2 ≃ 0) are still present but, statistically, their number contribution is less relevant. The same behaviour is seen for kmass, albeit with a broader distribution and a peak shifted towards smaller values. This can be primarily attributed to the definition of kmass, where the contribution of rotationally dominated systems, particularly the outer one, holds more weight in luminosity than it does in mass, especially in star-forming galaxies.
For the sake of clarity, we provide some examples showing different behaviour of the k1 and k2 parameters. We roughly identified three main groups in the (k1; k2) space, namely8:
– Galaxies with lowk1and lowk2. Figure 2 shows two examples (plate-IFUs: 8952-12704 and 9487-12705) of galaxies with k1, k2 and also klum and kmass close to zero. These two galaxies, according to the MaNGA Visual Morphology Catalogue (VMC-VAC, Vázquez-Mata et al. 2022), are classified as ellipticals and they do not show any clear rotational pattern. This should be enough to confidently state that no rotationally dominated component is present in these objects. Despite that, almost by construction, our best fit for these galaxies comprises two, additional components, the inner and the outer disc. However, these are needed primarily to compensate for our assumption that the dispersion-supported central component is purely spherical, while in this case the galaxy clearly shows a significant ellipticity. Nevertheless, from all points of view, both objects are dispersion-dominated.
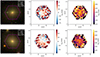 |
Fig. 2. Two examples of galaxies (i.e. 8952-12704 top row, 9487-12705 bottom row) with low k1 and k2. From left to right: SDSS gri image, l.o.s. stellar velocity, and l.o.s. stellar velocity dispersion. The magenta hexagon is the MaNGA field of view. |
– Galaxies with lowk1and highk2. Figure 3 shows two examples (plate-IFUs: 7959-12703 and 9089-12704) of galaxies with low k1 and high k2. As can be seen in the figure, both galaxies show features in their light profiles (e.g. bars, spirals and rings), and they have a clear rotational pattern with a quite significant central peak in the velocity dispersion. These galaxies have klum above 0.75, suggesting, as expected, the dominance of a disc. In both cases, the inner disc models the central, dispersion-dominated region of the galaxy. It is hard to interpret them as thin discs; more likely, they provide a correction to the inner region of the galaxies where the possibly secular bulge, given the presence of spirals and rings, may deviate from spherical symmetry. 7959-12703 has a higher k1 and a smaller bulge-to-inner-disc ratio (i.e. Lb/Ld1) compared to 9089-12704, looking at the data, it seems that 7959-12703 has slightly larger rotational support and a more disc-like light distribution in the centre.
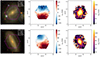 |
Fig. 3. Two examples of galaxies (i.e. 7959-12703 top row, 9089-12704 bottom row) with low k1 and high k2. From left to right: SDSS gri image, l.o.s. stellar velocity, and l.o.s. stellar velocity dispersion. The magenta hexagon is the MaNGA field of view. |
– Galaxies with highk1and highk2. Figure 4 shows two examples (plate-IFUs: 11946-12702 and 9090-12705) of galaxies with high k1, k2. Both galaxies show quite high l.o.s. velocity (middle panels of Fig. 4) even near the centre, explaining why a rotationally supported inner disc is required by the model. In these cases, the inner discs are spatially probing the transition region (i.e. between the bulge and the disc) of the galaxy, mostly contributing to the dynamically cold component of the galaxy (i.e. the galactic disc).
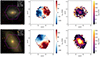 |
Fig. 4. Two examples of galaxies (i.e. 11946-12702 top row, 9090-12705 bottom row) with high k1 and high k2. From left to right: SDSS gri image, l.o.s. stellar velocity, and l.o.s. stellar velocity dispersion. The magenta hexagon is the MaNGA field of view. |
As demonstrated by such examples naively interpreting BANG’s visible components (i.e. bulge, inner disc, and outer disc) as the photometrically identified bulges and discs could lead to improper conclusions. Figure 5, which shows a comparison between BANG decomposition and a purely photometric approach (see e.g. PyMorph Domínguez Sánchez et al. 2022, for a photometric decomposition of MaNGA galaxies), indeed demonstrate an anti-correlation between photometrically identified bulges and the klum parameter. Galaxies with higher photometric B/T ratio are, on average, more dispersion supported (i.e. lower klum) although with an increasing scatter for larger B/T ratios. Indeed, even at photometric B/T as high as 0.8 galaxies cover a wide range of kinematic properties (i.e. 0.15 ≲ klum ≲ 0.70) with a number of objects still demonstrating strong rotational support (i.e. klum ≳ 0.70). Also in cases of dispersion-support (klum ≲ 0.15) galaxies span a range of photometric B/T ratios with some objects retaining even more than half of their light in a photometrically identified disc component despite the absence of net rotation. This ultimately demonstrates some of the difficulties that could arise when interpreting photometric bulges and discs. A characterisation of these components without the inclusion of the kinematics can be non-exhaustive since galaxies with the same value of B/T can reflect a variety of kinematic behaviours. In these regards, our approach helps in a better characterisation of galaxies structure and kinematics although, it is still not clear how far this can be pushed. For instance, it is still to be understood if BANG can fully identify and characterise pseudobulges in some well-defined region of its parameter space. In the future, we are planning to apply our approach to simulations where decomposition can be performed by exploiting the full 6D phase space information of the stars (Du et al. 2020; Zana et al. 2022).
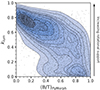 |
Fig. 5. Comparison between the luminosity-weighted kinematic tracer klum (vertical axis) and a purely photometric bulge-to-total ratio taken from Domínguez Sánchez et al. (2022) (horizontal axis). The contours (grey lines filled with the blue shaded colours) are drawn at probability levels with a constant spacing of 0.1 while the black dots represent the data. The vertical arrow on the right side qualitatively explains the meaning of the klum parameters: a greater klum value corresponds to higher rotational support within the galaxy. |
4. Mass budget and its dependence on kinematics and star formation
In this section, we aim to quantify the stellar mass budget of galaxies as a function of their kinematic state and distance from the star-forming main sequence (SFMS). Through this paper, we refer to as “main-sequence” galaxies those systems above –0.5 dex from the locus of the SFMS as defined in Fraser-McKelvie & Cortese (2022). Galaxies with lower SFR will be labelled as “below main-sequence” systems.
Before diving into the results, based on what was discussed in Sect. 3, we highlight some points that must be accounted for in the forthcoming analysis. First, if the goal is to estimate the contribution of different kinematic components to the mass budget of galaxies, we can not just assume that k1 and k2 always trace different kinematic components. Indeed, in some cases, they may trace the same component and it is actually their value (and relative difference) that provides important hints on the internal kinematic structure of galaxies. Secondly, treating k1 and k2 separately or combining them into klum (or kmass) may provide different results, as klum and kmass generally trace just the dominant kinematic components. This is why, in the present section, we compare both methods, looking at the mass budget of galaxies by either using klum and kmass or treating each component separately.
The main results of our analysis are summarised in Fig. 6. Here we show the cumulative distribution of different kinematic components per bin of galaxy stellar mass. The first column shows the results for our full sample, whereas the middle and right columns focus on the main-sequence or below main-sequence samples, respectively.
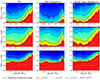 |
Fig. 6. Cumulative mass fractions depending on kinematics and star formation. Horizontal axes showing bins of stellar mass with the vertical axes showing the mass fraction as a function of different kinematic tracers (i.e. from top to bottom: klum, kmass and k1, k2). The colour-coding from red to blue indicates an increase in the rotational support. The left column refers to the whole sample, the middle column includes only below main-sequence galaxies (i.e. ΔMS < −0.5 dex) while the right column considers only main-sequence systems (i.e. ΔMS > −0.5 dex). The bottom legend shows the different thresholds x explicitly shown in the plot. |
Starting from panel (a), we show the cumulative distribution of mass as a function of klum, with highlighted arbitrary thresholds of 0.1, 0.3, 0.5, 0.7 to guide the eye. The colour coding maps the threshold levels on a continuous scale and it visually helps in the interpretation and comparison of the different panels9. The diagram is built as follows. First, for each galaxy falling in one of the stellar mass bins we compute klum following Eq. (1). Then, given a threshold x, the mass fraction within x is computed by summing the stellar mass of all those galaxies with klum below x and dividing by the total stellar mass in the bin; we refer to Table 2 for the exact values of the mass fraction10. It is important to note that this is a cumulative way of computing the mass fraction which, by construction, adds up to 1 when x = 1.0. Essentially, for a fixed stellar mass, given that klum traces the total rotational support of the galaxy, a higher presence of “cold” colours in the vertical direction means that more stellar mass lies in rotationally supported systems. Focusing on the red line (i.e. klum < 0.1), which refers to dispersion-supported systems, we note that it remains as small as few percents up to M⋆ ≃ 1011.0 M⊙, when it starts to rise, reaching up to ≃60% of the mass fraction for M⋆ ≃ 1012.0 M⊙. Even though the increase of the mass fraction in dispersion-supported systems with M⋆ is expected due to the presence of ellipticals, we highlight that panel (a) clearly shows that even for high-mass galaxies a considerable (≃30%) amount of mass resides in a, at least mildly, rotating component. This is quite in contrast with analysis relying on visual morphology, which tends to overestimate the importance of ellipticals and/or spheroids (i.e., 60% of the stellar mass fraction already at M⋆ ≃ 1011 M⊙Moffett et al. 2016; Bellstedt et al. 2024). Sources of possible visual morphology misclassification in photometric studies due to the lack of kinematic data were already been pointed out by several authors (Krajnović et al. 2008; Cappellari et al. 2011; Fraser-McKelvie & Cortese 2022); we provide in Appendix A two examples of visually classified elliptical galaxies with a clear rotational pattern.
Summary table of the mass fractions for the different kinematic tracers (i.e. k1, 2, kmass and, klum) for the whole sample, below main-sequence galaxies (i.e. ΔMS < −0.5 dex) and main-sequence galaxies (i.e. ΔMS > −0.5 dex).
Below M⋆ ≃ 1011 M⊙ the mass budget is clearly dominated by dynamically cold discs, even though galaxies with intermediate rotation (klum < 0.5) contribute up to 25%. The relevance of “intermediate” galaxies has already been reported by other authors (e.g. Fraser-McKelvie & Cortese 2022). In terms of the structure composing a galaxy, intermediate rotational support is supposed to be caused by the presence of thick discs, strong bars, prominent bulges, etc11. Unfortunately, our model does not account for such complexity and, right now, it is still impossible to disentangle between all of these possible cases. Particularly interesting are thick discs, whose presence is supposed to be ubiquitous in disc galaxies of any morphology. In our modelling, those are still described as razor-thin, an approximation which is less appropriate for highly inclined galaxies. Since in our sample, highly inclined galaxies are less than a few percent we do not expect such an effect to play a significant role. It is not clear whether thick discs can already be identified by our method, for instance, by looking at the k1 and k2 parameters. Despite that, given the promising results obtained so far, we plan to include those components in our modelling as we expect to be able to disentangle among them in future higher-resolution IFS surveys. Interestingly, the very low-mass bins seem to point towards a slight increase in the dispersion support compared to intermediate masses. Dwarf galaxies are expected to be more turbulent systems and similar results have already been reported in the literature (for instance with the CALIFA survey, Zhu et al. 2018a). However, at such small masses low signal-to-noise ratios and a stellar velocity dispersion of the order of the instrumental resolution can play a role and further investigation is needed to assess whether this trend extends below M⋆ < 109.5 M⊙. Overall, this panel provides a picture consistent with what recently obtained by IFS analysis focused on integrated values of stellar spin (λR) or V/σ, as klum ultimately provide the same type of information: an integrated, luminosity average estimate of the kinematic of galaxies (van de Sande et al. 2017; Guo et al. 2020; Fraser-McKelvie & Cortese 2022).
Panel (b) is built following the same steps as panel (a) with the only difference that we replaced klum with the mass-weighted estimator kmass. Similarly to panel (a), there is a clear trend of increasing mass fraction in dispersion-dominated systems with increasing M⋆. Overall, the qualitative behaviour of the two plots is similar, even though the colour coding in panel (b) is shifted towards redder colours, implying a more significant role of dispersion in the overall mass budget. This is expected since, in the majority of the cases, the M/L ratio in the inner regions (i.e. bulge and inner disc), where the galaxy has a stronger dispersion support, is larger than in the outer disc. As a result kmass is almost always smaller than klum by construction. This also implies that fully rotationally supported systems are extremely rare when we consider mass-weighted estimates.
Panel (c) is built in a slightly different way. Here, we compute the mass fraction by accounting for the different components of the model (i.e. dispersion-supported bulge, inner disc and outer disc) separately. More precisely, we start again by selecting galaxies according to different total stellar mass bins (i.e. horizontal axis of the panel). Then for every galaxy in the mass bin, we compute the mass-weighted cumulative mass distribution of k, where the weight is used by combining the mass of all components having a certain k value. We note that, since in our assumptions the bulge is fully dispersion-supported, its mass is automatically included for any threshold x (see the black dashed line in the plot). For instance, if a galaxy’s inner and outer disc are both dispersion-dominated (i.e. k1 < 0.1 and k2 < 0.1) then all the galaxy’s stellar mass will contribute to the first mass fraction bin (i.e. red line of the panel); on the contrary, in a case where only the outer disc is rotationally supported (i.e. k1 < 0.1 and k2 > 0.7) then only the classical bulge and the inner disc fall in the first mass fraction bin (i.e. x < 0.1, red region of the plot) whereas the outer disc contributes to the last mass fraction bin (i.e. x > 0.7, over the blue line of the panel).
Similarly to panels (a) and (b), we see an increase in the mass fraction of dispersion-dominated structures with galaxy stellar mass. Interestingly, the trend is mostly caused by an increase in the fraction of dispersion-dominated (i.e. k1 < 0.1 and/or k2 < 0.1) inner and outer discs while the dispersion-supported bulge component (dotted line) remains almost on a constant level. As we discussed before, the increase in the fraction of dispersion-dominated inner and outer discs with M⋆ is not unexpected, since it is mostly related to the presence of galaxies which are overall pressure-supported. Below M⋆ ≃ 1011 M⊙ the mass fraction in a dispersion inner component (i.e. k1, 2 < 0.1) remains nearly constant at a level of ≃40%. Similarly, the mass in the dispersion-supported bulge does not show significant trends with stellar mass roughly contributing to ≃30% of the mass fraction. There are two key differences between panels (c) and (a) or (b). First, the contribution of dispersion-supported structures is significantly higher, in particular below M⋆ < 1011.5 M⊙. This is simply because dispersion-supported structures rarely dominate the mass budget of an individual galaxy. As such, their presence is often washed out by integrated estimates, although once combined they can easily contribute to 30–40% of the total mass budget. Secondly, the fraction of mass in “intermediate” structures (0.1 < k1, 2 < 0.7) is significantly lower (≲20%), with most of the mass being in either dispersion-supported or rotation-supported systems. Again, this is because averaging a pure bulge and a pure disc artificially creates a system with intermediate k. It is important to stress that this is not driven by our technique, as we actually allow for k to cover every possible parameter. Instead, it nicely shows that our approach quantitatively confirms the generally accepted picture that galaxies are composed of two dominant and distinct structures: one almost entirely rotation-supported and the other dispersion-supported.
We now proceed with the discussion by analysing and comparing the middle and the right columns of Fig. 6. We build these plots following, row by row, the same procedure described before dividing the sample into main-sequence galaxies (i.e. ΔMS > −0.5 dex) and below main-sequence (i.e. ΔMS < −0.5 dex) galaxies.
As expected, the dispersion-supported mass fraction at high masses is dominated by below main-sequence galaxies. Indeed, panels (g–i) show a significant increase in the region below x < 0.1, where x can either be klum, kmass or k1, 2, of the plot with increasing mass, especially above M⋆ ≃ 1011 M⊙, except for a possible tiny spike at M⋆ > 1011.5 M⊙. Such spike could be due to poor statistics: indeed, the last mass bin is empty since there were no star-forming galaxies at such high masses in our sample12. If we focus below M⋆ ≃ 1011 M⊙ we see a striking difference between panels (d) and (g): the majority of galaxy mass at high klum is on the star-forming main-sequence. This is in line with what was found in many previous works (Bell et al. 2012; Cappellari 2013; Omand et al. 2014; Lang et al. 2014; Kawinwanichakij et al. 2017), and it has been used as evidence for the need to invoke structural transformation during or after quenching. However, this picture is challenged if we focus on panels (e) and (h) where the difference is much less evident when using kmass as a tracer. In this case, for example, the mass fraction with kmass < 0.5 is very similar for main-sequence and below main-sequence galaxies. This behaviour may be hinting at an evolution away from the SFMS which does not involve significant modification of the galaxy structure. More explicitly, since most of the star formation happens in the galactic disc, the process of quenching mostly affects its luminosity, and therefore its M/L ratio. Moreover, in cases when the quenching is not caused by strong gravitational interactions, there are no particular reasons why it should imply a strong change in the dynamical structure of the galaxy and this is most likely why we do not see significant differences below M⋆ ≃ 1010 M⊙ comparing panels (e) and (h). This result is supported, and reinforced, by panels (f) and (i), which may provide some insights into the structural transformation of galaxies. Above M⋆ ≃ 1011 M⊙, there is clearly an increasing importance of dispersion-supported structures, suggesting that quenched galaxies have experienced significant gravitational perturbation. Below this mass, the difference in mass stored in rotationally supported and dispersion-supported structures is minimal, of the order of 10% or less. This suggests that passive galaxies have undergone a limited structural transformation during or after their quenching phase.
5. Discussion
Figure 7 shows the cumulative stellar mass fraction as a function of klum (left panel, dashed lines), kmass (middle panel, bold lines) and k1, 2 (right panel, dotted lines) for main-sequence (downward triangle) and below main-sequence (upward triangle) galaxies. The three panels on top refer to the whole sample while the middle row differentiates among galaxies above M⋆ ≃ 1011 M⊙ in red colours and galaxies below M⋆ ≃ 1011 M⊙ in blue colours. The bottom panel directly compares the difference (i.e. Δk) between main-sequence and below main-sequence galaxies for the whole sample among different kinematic tracers. We reported as well in Table 3 the cumulative mass fractions for the whole sample and for galaxies below and above 1011 M⊙ to quantitatively compare among main-sequence and below main-sequence galaxies13.
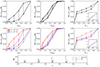 |
Fig. 7. Cumulative mass fraction integrated over the whole range of masses of klum (left, dashed line), kmass (middle, solid line) and k1, 2 (right, dotted line). Upward triangles show below main-sequence galaxies while the downward triangles refer to main-sequence galaxies. The three panels on the top row refer to the whole sample while the middle row differentiates between galaxies with M⋆ > 1011 M⊙ in red and galaxies with M⋆ < 1011 M⊙ in blue. The panel in the bottom row illustrates the difference between main-sequence and below main-sequence galaxies (i.e. Δk) for the whole sample as a function of k. |
Cumulative mass fraction for the different kinematic tracers (i.e. k1, 2, kmass and klum) for below main-sequence galaxies (i.e. ΔMS < −0.5 dex) and main-sequence galaxies (i.e. ΔMS > −0.5 dex).
Focusing on klum first, we see a strong dependence on whether the galaxy is on the main sequence or below it, with below main-sequence galaxies more dispersion-supported than main-sequence galaxies. Interestingly, such difference becomes stronger for higher degrees of rotational support reaching a maximum of Δk ≃ 0.5. When dividing according to stellar mass (bottom left panel of Fig. 7) we observe that massive galaxies are overall more dispersion-dominated than their less massive counterpart. Δk monotonically increases as a function of klum for galaxies below M⋆ ≃ 1011 M⊙ being as large as Δk ≃ 0.5 at klum ≃ 0.7.
This trend is much reduced when employing mass-weighted estimators. While galaxies below the main sequence still demonstrate higher dispersion support than their main-sequence counterparts, the difference is less significant and, opposite to what is seen for klum, slightly diminishes at larger k-values. Similarly, when dividing according to stellar mass (bottom middle panel of Fig. 7) we observe an almost negligible Δk for galaxies below M⋆ ≃ 1011 M⊙, while the difference is larger for more massive galaxies. Interestingly, massive main-sequence galaxies show similar properties to their less massive counterparts.
Looking at the right panels of Fig. 7 we see that about 40% of the mass fraction lies below k1, 2 ≤ 0.1. This is due to the common presence of a dispersion-supported inner region in the galaxies of our sample. At intermediate values of k1, 2, we do not observe a significant increase in the mass fraction as most of the mass is in dispersion-supported (i.e. k1, 2 < 0.1) or rotationally supported (i.e. k1, 2 > 0.7) components. This behaviour is particularly evident when focusing on galaxies below M⋆ ≃ 1011 M⊙ (bottom right panel of Fig. 7). We note that, similarly to what observed for kmass, Δk is significantly smaller for less massive galaxies than their more massive counterpart.
All of these findings have important implications for the interpretation of our results in a broader context. Luminosity-weighted kinematic tracers not only capture changes in a galaxy dynamics but also in its SFR. While this may be informative in certain scenarios, it can lead to biased interpretations of the relationship between kinematics and quenching. In this context, the decrease in rotational support should be viewed more as a consequence than a cause of quenching. As galaxies deviate from the SFMS, their discs cease star formation, leading to a decrease in luminosity (and an increase in the M/L ratio). Consequently, given that the disc retains most of the galaxy’s angular momentum, a galaxy below the main sequence may exhibit an apparent reduction in (luminosity-weighted) rotation support compared to another main-sequence galaxy with similar intrinsic kinematics. Indeed, most of the difference between luminosity- and mass-weighted results is for main-sequence galaxies. Considering that many studies on galaxy dynamics rely on light-weighted properties such as V/σ or λR (Cappellari et al. 2007; Emsellem et al. 2007; Zhu et al. 2024), caution is advised, as our findings indicate the difficulty of disentangling trends in galaxy kinematics from variations in the underlying stellar population when relying on light-weighted tracers. This caution extends to the assumption of a constant stellar M/L ratio commonly made in dynamical models (Zhu et al. 2018b; Santucci et al. 2022; Jin et al. 2024). Our modelling incorporates, through three distinct M/L ratios (one for each visible component), a radial variation of the galaxy’s average M/L ratio enhancing the disparity in behaviours between klum and kmass. It is important to note that assuming a constant M/L ratio would have led to identical definitions for klum and kmass, effectively washing out any distinction between light-weighted and mass-weighted quantities. This highlights the need to consider radial gradients of the M/L ratio in dynamics a fact that has recently been pointed out in Liang et al. (2023) and Chu et al. (2024).
Focusing on the physical interpretation of our findings, we conclude that the small spread in the mass-weighted M(< k)/M* (compared to its luminosity-weighted counterpart, see middle and right panels of Fig. 7) and its decrease with increasing galaxy rotational support point towards a little structural evolution as galaxies depart from the SFMS. Below M⋆ < 1011 M⊙, a connection between galaxy quenching and structural/morphological transformation is less strong than what was previously thought. Instead, the predominant factor at play appears to be associated with disc fading. Such a scenario has already been advocated by several authors (Blanton et al. 2005; Cortese & Hughes 2009; Woo et al. 2017; Cortese et al. 2019; Croom et al. 2021).
This can have important implications in the context of the evolution of S0 galaxies. Lenticular galaxies, in comparison to spirals, typically exhibit reduced rotational support. For instance, S0 galaxies follow a Fall relation (i.e. stellar specific angular momentum vs stellar mass, Fall 1983) parallel to that of spirals but for a lower intercept and hence, a lower specific angular momentum at fixed mass. However, when these galaxies are decomposed into their bulge and disc components the picture changes. Discs of lenticular galaxies follow the same Fall relation as that of spirals (Rizzo et al. 2018) suggesting a structural similarity between the two. The lower rotational support of lenticulars is not a consequence of a strong modification of the galactic disc. Instead, it is likely a consequence of a change in the ratio between their inner dispersion-dominated component and their rotationally supported disc component. This interpretation gains further support from our analysis. When the disc of the progenitor of an S0 galaxy ceases star formation its light dims and, as a consequence, its light-weighted kinematics decreases towards a lower rotational support.
Interestingly studies examining the individual spectra of bulges and disc in S0s (see e.g. Fraser-McKelvie et al. 2018; Domínguez Sánchez et al. 2020; Johnston et al. 2022) unveiled a dependence of the assembly history of these components on stellar mass. Bulges within galaxies with stellar masses exceeding ≳1010 M⊙ assemble most of their mass early in their lifetimes, whereas those in lower-mass galaxies formed over more extended timescales and more recently. Such observations have been interpreted as supporting evidence for the formation of massive S0 galaxies occurring via an inside-out scenario, while in lower-mass S0s, the bulges and discs either formed together or through an outside-in scenario14. Differently from this work, those studies relied on a luminosity-based bulge+disc decomposition and did not consider the separate kinematics of bulges and discs in their analysis so it is not clear if a change in behaviours should be evident also from our analysis. Interestingly, Fig. 6 hints towards a moderate increase in the mass within mildly rotating discs (i.e. k1, 2 ≃ 0.5) below ≲1010 M⊙, although a focused and joint analysis of the kinematics and the stellar population is required before drawing any conclusion on a possible correlation of the two effects.
Nonetheless, indications of a minimal structural evolution persist even when considering mass-weighted quantities. Such behaviour may be due to different reasons. Here we speculate about two possible explanations. Firstly, we note, by comparing Figs. 6f and i and by looking at the right panel of Fig. 7, that below M⋆ < 1011 M⊙ the amount of mass in the dispersion-supported central region (i.e. k1, 2 < 0.1) changes minimally for main-sequence and below main-sequence galaxies, while a larger difference can be seen at higher thresholds, namely k1, 2 = 0.5 and k1, 2 = 0.7. From this observation, we infer that if structural modifications are indeed present, they likely predominantly influence the dynamics and structure of the galactic disc. This hypothesis gains support from simulations suggesting that the spheroidal mass component of galaxies is established early in the Universe, undergoing minimal changes after z < 2 (Tacchella et al. 2019). The increased dispersion support in below main-sequence galaxies may result from a thickening of the disc. This scenario is supported by the consideration that quenched galaxies, being generally older than their star-forming counterparts, may have attained a stable disc-like configuration in earlier epochs when discs were more turbulent, resulting in a thicker structure (Pinna et al. 2024). Another possibility is that for fixed stellar mass, galaxies that grow their disc faster (and therefore assemble most of their mass at early times, being less star forming at z = 0) are more likely to undergo bar instability (Fraser-McKelvie et al. 2020; Izquierdo-Villalba et al. 2022). Notably, stellar bars are dynamically stable structures that tend to increase the disc dispersion support (e.g. Grand et al. 2016, and references therein), contributing to the galactic morphological evolution15.
Of course, these scenarios are not valid above M⋆ > 1011 M⊙, where our results point towards a different mechanism responsible for quenching massive galaxies. In this case, below main-sequence galaxies demonstrate a substantial change in their structure even though such process is segregated only at very high masses. The mass threshold of 1011 M⊙ is consistent with galaxies assembling more than 50% of their stellar mass through mergers (Oser et al. 2010; Tacchella et al. 2019) and with the critical mass above which dry mergers relics dominate (Peng et al. 2010; Cappellari 2016). Interestingly, we find at M⋆ ≃ 1011.5 M⊙ a mass fraction in dispersion-dominated structures (Fig. 6i) close to 0.7 consistent with the ex situ mass fraction at z = 0 reported in Tacchella et al. (2019). This leads us to conclude that the importance of mergers in quenching galaxies and changing their morphology is confined to a very limited range of masses (i.e. M⋆ > 1011 M⊙).
6. Summary and conclusions
In this work, we exploited the analysis presented in (Rigamonti et al. 2023) with the publicly available code BANG (Rigamonti et al. 2022b) on a morpho-kinematic decomposition of galaxies from the final data release of the MaNGA survey (Bundy et al. 2015; Abdurro’uf et al. 2022).
More specifically, we took advantage of BANG’s ability to disentangle between the different galaxies components while characterising, through the parameters k1 and k2, their dynamical state (i.e. whether they are rotation- or dispersion-dominated). Moreover, by defining mass- or light-weighted kinematic tracers (i.e. klum, kmass), we characterised the dynamical state of galaxies as a whole. Depending on these parameters (k1, k2, kmass and, klum) we were able to quantify in a generalised way the mass budget in the local Universe within the different galaxy components (i.e. dispersion-supported bulges and discs), for different type of galaxies (i.e. rotationally supported or dispersion-supported) and depending on their location on the SFMS (i.e. below main-sequence galaxies: ΔMS < −0.5 dex and main-sequence galaxies: ΔMS > −0.5 dex). The main results are reported in Table 3 and in Figs. 6 and 7 and can be summarised as follows:
-
In our sample, we found that ≃8% of the mass resides in dispersion-dominated galaxies (i.e. klum < 0.116). Most of this mass (≃6%) comes from massive (i.e. M⋆ > 1011 M⊙) below main-sequence galaxies. Galaxies with higher rotational support can still retain a significant fraction of their mass in a dispersion-dominated inner region which accounts for ≃40–45% of the mass in the whole sample.
-
Above the critical mass of M⋆ ≃ 1011 M⊙, the importance of passive, slowly rotating galaxies strongly increases. This result is independent of the technique used to differentiate between rotation- and dispersion-dominated systems. Following previous studies (Cappellari 2016; van de Sande et al. 2017; Tacchella et al. 2019), we explain these trends in terms of mergers being the main mechanism shaping massive slow rotators and halting their star formation. Compared to previous results, based on photometric approaches (Gadotti 2009; Lange et al. 2016; Moffett et al. 2016; Bellstedt et al. 2024), our analysis segregates the role of mergers at higher masses highlighting the necessity of kinematic information to avoid misclassifications between spheroids and rotating passive systems (Emsellem et al. 2011; Krajnović et al. 2013; Cortese et al. 2016).
-
Below M⋆ ≃ 1011 M⊙, galaxies span a wide, continuous range of klum, kmass or, similarly, of rotation-to-dispersion support. Interestingly, when looking at the galaxy different components, they naturally separate into a dispersion-dominated inner region and a rotationally supported outer disc. Only a minor amount of mass resides in structures with intermediate rotation so that the overall galaxy dynamical support is determined by the relative weight of its dispersion-dominated and rotation-dominated components. This shows BANG’s ability to decompose galaxies into physically motivated structures, stressing again the relevance of addressing and extending the bulge+disc problem from an IFS perspective.
-
Luminosity-based tracers of the kinematics encapsulate differences not only in the dynamical structure of a galaxy but also in their star formation history. Below M⋆ ≃ 1011 M⊙, we observe a large difference in kinematic properties of galaxies as a function of their position in the star formation mass plane, when relying on luminosity-based tracers. The same difference is much less significant when considering mass-based quantities. Such difference between luminosity- or mass-weighted estimators is observable only thanks to our assumption of a spatially variable mass-to-light ratio. We conclude that relying on luminosity-based estimators can lead, in some circumstances, to a biased interpretation of the physical processes at play. Moreover, the assumption of a constant mass-to-light ratio commonly made in dynamical models can have a non-negligible impact on the estimated properties of galaxies.
-
Given the small difference of the mass-weighted kinematics among main-sequence and below main-sequence galaxies we conclude that in the mass range 109.75 M⊙ < M⋆ < 1011 M⊙, morphology and quenching have only a minor correlation as the main process at play is disc fading. Our work has indeed probed that, in the local Universe, there is no evidence for quenching being the cause or being caused by a morphological transformation.
It is important to note that these are exactly the same properties of the bulge component adopted in BANG.
This process is also known as “morphological quenching”.
https://pypi.org/project/BANGal/
The pixel size is 0.5″ and the average full width at half maximum (FWHM) of the SDSS i-band point spread function (PSF) is ∼1.2″. Our choice is indeed similar to what done in Gadotti (2009). We refer to Paper II for a discussion about this.
Note the by definition the bulge l.o.s. velocity is zero.
For each luminous o baryonic component we consider the mass within Rmax defined as the maximum radius along the galaxy major axis for which MaNGA provides the kinematic. This choice is similar to what was done in Paper II; we verified that the total stellar mass within Rmax is consistent with the measurements provided by the NASA-Sloan Atlas (NSA) http://nsatlas.org/.
We refer to Appendix B and to Paper II for a comparison of klum with the more commonly adopted kinematic tracers λR and V/σ.
Exceptions to these three classes are present even though they do not play a relevant role in our discussion; for completeness, we provide some show-case examples in Appendix C.
We arbitrarily choose red for high dispersion support (i.e., x = 0.1) and dark blue for rotational support (i.e., x = 1.0).
For reasons of clarity we report the fractions in larger mass bins as compared to Fig. 6. The values with the finer binning are available on request.
We note that, as it has recently been pointed out by Croom et al. (2021), intermediate rotation can be also caused by disc fading. We refer to Sect. 5 for a detailed discussion.
We considered mass bins with at least ten galaxies in them.
We note that all the fractions reported in Table 3 are directly comparable to each other since to compute them we used the total stellar mass of the whole sample as a common denominator.
It is important to note that these conclusions were drawn from studies with relatively limited statistical samples of few hundred galaxies.
We note that bars are more commonly found in redder, less-star-forming galaxies suggesting a strong link between the presence of bars and galaxy quenching (see, e.g. Gavazzi et al. 2015).
It is important to note that this threshold is arbitrary. We reported in Table 3 the cumulative mass fractions for other thresholds.
Acknowledgments
We thank the anonymous referee for their comments and suggestions that helped us to improve the quality of the paper. M.D. acknowledges funding from MIUR under the grant PRIN 2017-MB8AEZ, and financial support from ICSC – Centro Nazionale di Ricerca in High Performance Computing, Big Data and Quantum Computing, funded by European Union – NextGenerationEU. L.C. acknowledges support from the Australian Research Council Future Fellowship and Discovery Project funding scheme (FT180100066, DP210100337). Parts of this research were conducted by the Australian Research Council Centre of Excellence for All Sky Astrophysics in 3 Dimensions (ASTRO 3D), through project number CE170100013. FR acknowledges support via the ASTRO 3D science visitor program scheme and the CINECA award under the ISCRA initiative, for the availability of high-performance computing resources and support. The data underlying this article will be shared on reasonable request to the corresponding author.
References
- Abdurro’uf, Accetta, K., Aerts, C., et al. 2022, ApJS, 259, 35 [NASA ADS] [CrossRef] [Google Scholar]
- Bell, E. F., van der Wel, A., Papovich, C., et al. 2012, ApJ, 753, 167 [CrossRef] [Google Scholar]
- Bellstedt, S., Robotham, A. S. G., Driver, S. P., et al. 2024, MNRAS, 528, 5452 [CrossRef] [Google Scholar]
- Blanton, M. R., Eisenstein, D., Hogg, D. W., Schlegel, D. J., & Brinkmann, J. 2005, ApJ, 629, 143 [Google Scholar]
- Blanton, M. R., Bershady, M. A., Abolfathi, B., et al. 2017, AJ, 154, 28 [Google Scholar]
- Brinchmann, J., Charlot, S., White, S. D. M., et al. 2004, MNRAS, 351, 1151 [Google Scholar]
- Bundy, K., Bershady, M. A., Law, D. R., et al. 2015, ApJ, 798, 7 [Google Scholar]
- Cappellari, M. 2013, ApJ, 778, L2 [NASA ADS] [CrossRef] [Google Scholar]
- Cappellari, M. 2016, MNRAS, 466, 798 [Google Scholar]
- Cappellari, M., Emsellem, E., Bacon, R., et al. 2007, MNRAS, 379, 418 [Google Scholar]
- Cappellari, M., Emsellem, E., Krajnović, D., et al. 2011, MNRAS, 416, 1680 [Google Scholar]
- Chu, J., Tang, H., Xu, D., Lu, S., & Long, R. 2024, MNRAS, 528, 6354 [NASA ADS] [CrossRef] [Google Scholar]
- Cortese, L., & Hughes, T. M. 2009, MNRAS, 400, 1225 [NASA ADS] [CrossRef] [Google Scholar]
- Cortese, L., Fogarty, L. M. R., Bekki, K., et al. 2016, MNRAS, 463, 170 [NASA ADS] [CrossRef] [Google Scholar]
- Cortese, L., van de Sande, J., Lagos, C. P., et al. 2019, MNRAS, 485, 2656 [Google Scholar]
- Cortese, L., Fraser-McKelvie, A., Woo, J., et al. 2022, MNRAS, 513, 3709 [NASA ADS] [CrossRef] [Google Scholar]
- Cox, T. J., Jonsson, P., Primack, J. R., & Somerville, R. S. 2006, MNRAS, 373, 1013 [Google Scholar]
- Croom, S. M., Taranu, D. S., van de Sande, J., et al. 2021, MNRAS, 505, 2247 [CrossRef] [Google Scholar]
- Dehnen, W. 1993, MNRAS, 265, 250 [NASA ADS] [CrossRef] [Google Scholar]
- Domínguez Sánchez, H., Bernardi, M., Nikakhtar, F., Margalef-Bentabol, B., & Sheth, R. K. 2020, MNRAS, 495, 2894 [CrossRef] [Google Scholar]
- Domínguez Sánchez, H., Margalef, B., Bernardi, M., & Huertas-Company, M. 2022, MNRAS, 509, 4024 [Google Scholar]
- Driver, S. P., Robotham, A. S. G., Bland-Hawthorn, J., et al. 2013, MNRAS, 430, 2622 [NASA ADS] [CrossRef] [Google Scholar]
- Drory, N., MacDonald, N., Bershady, M. A., et al. 2015, AJ, 149, 77 [CrossRef] [Google Scholar]
- Du, M., Ho, L. C., Debattista, V. P., et al. 2020, ApJ, 895, 139 [CrossRef] [Google Scholar]
- Emsellem, E., Cappellari, M., Krajnović, D., et al. 2007, MNRAS, 379, 401 [Google Scholar]
- Emsellem, E., Cappellari, M., Krajnović, D., et al. 2011, MNRAS, 414, 888 [Google Scholar]
- Erwin, P., Saglia, R. P., Fabricius, M., et al. 2015, MNRAS, 446, 4039 [Google Scholar]
- Erwin, P., Seth, A., Debattista, V. P., et al. 2021, MNRAS, 502, 2446 [NASA ADS] [CrossRef] [Google Scholar]
- Fall, S. M. 1983, in Internal Kinematics and Dynamics of Galaxies, ed. E. Athanassoula, 100, 391 [Google Scholar]
- Fall, S. M., & Efstathiou, G. 1980, MNRAS, 193, 189 [NASA ADS] [CrossRef] [Google Scholar]
- Fraser-McKelvie, A., & Cortese, L. 2022, ApJ, 937, 117 [NASA ADS] [CrossRef] [Google Scholar]
- Fraser-McKelvie, A., Aragón-Salamanca, A., Merrifield, M., et al. 2018, MNRAS, 481, 5580 [Google Scholar]
- Fraser-McKelvie, A., Merrifield, M., Aragón-Salamanca, A., et al. 2020, MNRAS, 499, 1116 [CrossRef] [Google Scholar]
- Fraser-McKelvie, A., Cortese, L., van de Sande, J., et al. 2021, MNRAS, 503, 4992 [NASA ADS] [CrossRef] [Google Scholar]
- Gadotti, D. A. 2009, MNRAS, 393, 1531 [Google Scholar]
- Gadotti, D. A., Bittner, A., Falcón-Barroso, J., et al. 2020, A&A, 643, A14 [NASA ADS] [CrossRef] [EDP Sciences] [Google Scholar]
- Gavazzi, G., Consolandi, G., Dotti, M., et al. 2015, A&A, 580, A116 [NASA ADS] [CrossRef] [EDP Sciences] [Google Scholar]
- Grand, R. J. J., Springel, V., Gómez, F. A., et al. 2016, MNRAS, 459, 199 [Google Scholar]
- Gunn, J. E., Siegmund, W. A., Mannery, E. J., et al. 2006, AJ, 131, 2332 [NASA ADS] [CrossRef] [Google Scholar]
- Guo, K., Cortese, L., Obreschkow, D., et al. 2020, MNRAS, 491, 773 [NASA ADS] [Google Scholar]
- Hubble, E. P. 1926, ApJ, 64, 321 [Google Scholar]
- Izquierdo-Villalba, D., Bonoli, S., Rosas-Guevara, Y., et al. 2022, MNRAS, 514, 1006 [NASA ADS] [CrossRef] [Google Scholar]
- Jin, Y., Zhu, L., Zibetti, S., et al. 2024, A&A, 681, A95 [NASA ADS] [CrossRef] [EDP Sciences] [Google Scholar]
- Johnston, E. J., Häußler, B., Aragón-Salamanca, A., et al. 2017, MNRAS, 465, 2317 [Google Scholar]
- Johnston, E. J., Häußler, B., Jegatheesan, K., et al. 2022, MNRAS, 514, 6141 [NASA ADS] [CrossRef] [Google Scholar]
- Kawinwanichakij, L., Papovich, C., Quadri, R. F., et al. 2017, ApJ, 847, 134 [NASA ADS] [CrossRef] [Google Scholar]
- Kormendy, J., & Bender, R. 2012, ApJS, 198, 2 [Google Scholar]
- Kormendy, J., & Kennicutt, R. C. 2004, ARA&A, 42, 603 [Google Scholar]
- Krajnović, D., Bacon, R., Cappellari, M., et al. 2008, MNRAS, 390, 93 [Google Scholar]
- Krajnović, D., Alatalo, K., Blitz, L., et al. 2013, MNRAS, 432, 1768 [Google Scholar]
- Lang, P., Wuyts, S., Somerville, R. S., et al. 2014, ApJ, 788, 11 [NASA ADS] [CrossRef] [Google Scholar]
- Lange, R., Moffett, A. J., Driver, S. P., et al. 2016, MNRAS, 462, 1470 [NASA ADS] [CrossRef] [Google Scholar]
- Liang, Y., Xu, D., Sluse, D., Sonnenfeld, A., & Shu, Y. 2023, ArXiv e-prints [arXiv:2311.07442] [Google Scholar]
- López-Sanjuan, C., Le Fèvre, O., Ilbert, O., et al. 2012, A&A, 548, A7 [Google Scholar]
- Martig, M., Bournaud, F., Teyssier, R., & Dekel, A. 2009, ApJ, 707, 250 [Google Scholar]
- Méndez-Abreu, J., Sánchez, S. F., & de Lorenzo-Cáceres, A. 2019, MNRAS, 484, 4298 [Google Scholar]
- Moffett, A. J., Lange, R., Driver, S. P., et al. 2016, MNRAS, 462, 4336 [NASA ADS] [CrossRef] [Google Scholar]
- Navarro, J. F., Frenk, C. S., & White, S. D. M. 1996, ApJ, 462, 563 [Google Scholar]
- Oh, S., Yi, S. K., Cortese, L., et al. 2016, ApJ, 832, 69 [CrossRef] [Google Scholar]
- Omand, C. M. B., Balogh, M. L., & Poggianti, B. M. 2014, MNRAS, 440, 843 [NASA ADS] [CrossRef] [Google Scholar]
- Oser, L., Ostriker, J. P., Naab, T., Johansson, P. H., & Burkert, A. 2010, ApJ, 725, 2312 [Google Scholar]
- Pak, M., Lee, J. H., Oh, S., et al. 2021, ApJ, 921, 49 [NASA ADS] [CrossRef] [Google Scholar]
- Peng, C. Y., Ho, L. C., Impey, C. D., & Rix, H.-W. 2002, AJ, 124, 266 [Google Scholar]
- Peng, Y.-j., Lilly, S. J., Kovač, K., et al. 2010, ApJ, 721, 193 [NASA ADS] [CrossRef] [Google Scholar]
- Pinna, F., Walo-Martín, D., Grand, R. J. J., et al. 2024, A&A, 683, A236 [NASA ADS] [CrossRef] [EDP Sciences] [Google Scholar]
- Rigamonti, F., Dotti, M., Covino, S., et al. 2022a, MNRAS, 513, 6111 [NASA ADS] [Google Scholar]
- Rigamonti, F., Dotti, M., Covino, S., et al. 2022b, Astrophysics Source Code Library [record ascl:2205.022] [Google Scholar]
- Rigamonti, F., Dotti, M., Covino, S., et al. 2023, MNRAS, 525, 1008 [NASA ADS] [CrossRef] [Google Scholar]
- Rizzo, F., Fraternali, F., & Iorio, G. 2018, MNRAS, 476, 2137 [Google Scholar]
- Salim, S., Lee, J. C., Janowiecki, S., et al. 2016, ApJS, 227, 2 [NASA ADS] [CrossRef] [Google Scholar]
- Salim, S., Boquien, M., & Lee, J. C. 2018, ApJ, 859, 11 [Google Scholar]
- Santucci, G., Brough, S., van de Sande, J., et al. 2022, ApJ, 930, 153 [NASA ADS] [CrossRef] [Google Scholar]
- Schwarzschild, M. 1979, ApJ, 232, 236 [NASA ADS] [CrossRef] [Google Scholar]
- Simard, L., Mendel, J. T., Patton, D. R., Ellison, S. L., & McConnachie, A. W. 2011, ApJS, 196, 11 [CrossRef] [Google Scholar]
- Skilling, J. 2004, in American Institute of Physics Conference Series, eds. R. Fischer, R. Preuss, & U. V. Toussaint, AIP Conf. Ser., 735, 395 [NASA ADS] [Google Scholar]
- Tabor, M., Merrifield, M., Aragón-Salamanca, A., et al. 2017, MNRAS, 466, 2024 [NASA ADS] [CrossRef] [Google Scholar]
- Tabor, M., Merrifield, M., Aragón-Salamanca, A., et al. 2019, MNRAS, 485, 1546 [NASA ADS] [CrossRef] [Google Scholar]
- Tacchella, S., Diemer, B., Hernquist, L., et al. 2019, MNRAS, 487, 5416 [Google Scholar]
- Thanjavur, K., Simard, L., Bluck, A. F. L., & Mendel, T. 2016, MNRAS, 459, 44 [NASA ADS] [CrossRef] [Google Scholar]
- van de Sande, J., Bland-Hawthorn, J., Brough, S., et al. 2017, MNRAS, 472, 1272 [NASA ADS] [CrossRef] [Google Scholar]
- van Dokkum, P. G., Whitaker, K. E., Brammer, G., et al. 2010, ApJ, 709, 1018 [Google Scholar]
- Vázquez-Mata, J. A., Hernández-Toledo, H. M., Avila-Reese, V., et al. 2022, MNRAS, 512, 2222 [CrossRef] [Google Scholar]
- Wake, D. A., Bundy, K., Diamond-Stanic, A. M., et al. 2017, AJ, 154, 86 [Google Scholar]
- Westfall, K. B., Cappellari, M., Bershady, M. A., et al. 2019, AJ, 158, 231 [Google Scholar]
- Woo, J., Carollo, C. M., Faber, S. M., Dekel, A., & Tacchella, S. 2017, MNRAS, 464, 1077 [NASA ADS] [CrossRef] [Google Scholar]
- Zana, T., Lupi, A., Bonetti, M., et al. 2022, MNRAS, 515, 1524 [NASA ADS] [CrossRef] [Google Scholar]
- Zhu, L., van de Ven, G., Méndez-Abreu, J., & Obreja, A. 2018a, MNRAS, 479, 945 [Google Scholar]
- Zhu, L., van de Ven, G., van den Bosch, R., et al. 2018b, Nat. Astron., 2, 233 [Google Scholar]
- Zhu, K., Lu, S., Cappellari, M., et al. 2024, MNRAS, 527, 706 [Google Scholar]
Appendix A: Missclassified ellipticals
Fig. A.1 shows two examples (11012-3701 top row, 10502-3702 bottom row) of galaxies classified as ellipticals according to the VMC-VAC (Vázquez-Mata et al. 2022) that exhibit a clear rotational pattern.
11012-3701 has a stellar mass of M⋆ = 1011.54 M⊙ while 10502-3702 has a stellar mass of M⋆ = 1010.83 M⊙. In both cases klum indicates a quite strong rotational support.
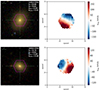 |
Fig. A.1. Two examples of galaxies (i.e. 11012-3701 top row, 10502-3702 bottom row) classified as ellipticals according to the VMC-VAC (Vázquez-Mata et al. 2022) with a clear rotational pattern. |
Appendix B: Comparison with other kinematic tracers
In this section, we compare the kinematic tracer klum used in this work with the more commonly adopted λR. For the comparison we consider λR estimates presented in (Fraser-McKelvie et al. 2021) corrected for inclination and seeing.
The two parameters correlate with each other although some scatter is present. The correlation is close to linear, demonstrating the physical meaning of the klum parameter adopted throughout this work. We refer to Paper II for a comparison with V/σ.
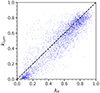 |
Fig. B.1. Comparison between klum and λR. The blue dots are the data while the black dashed line is the one-to-one relation. For the comparison we consider λR estimates presented in (Fraser-McKelvie et al. 2021) corrected for inclination and seeing. |
Appendix C: Further examples on k1 and k2
Here we show two examples of galaxies with k1 larger than k2.
9085-1902 is a galaxy with a clear rotational pattern where the IFU (i.e. the magenta hexagon in the top left panel of Fig. C.1) is probably not caching the whole galactic disc. In this case, the galaxy shows mild rotational support (i.e. klum ≃ 0.4) modelled through a rotationally supported inner disc (k1 ≃ 0.9) which primarily contributes to the galactic disc.
11007-12705 is a compact galaxy with klum ≃ 0.4. In this case, the presence of a rotationally supported inner disc can be understood by looking at the velocity field (i.e. second row, middle panel of Fig. C.1) which hints at some sort of regular rotation in the galaxy centre.
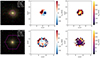 |
Fig. C.1. Two examples of galaxies (i.e. 9085-1902 top row, 11007-12705 bottom row) with high k1 and low k2. From left to right: SDSS gri image, l.o.s. stellar velocity, and l.o.s. stellar velocity dispersion. The magenta hexagon is the MaNGA field of view. |
All Tables
Summary table of the mass fractions for the different kinematic tracers (i.e. k1, 2, kmass and, klum) for the whole sample, below main-sequence galaxies (i.e. ΔMS < −0.5 dex) and main-sequence galaxies (i.e. ΔMS > −0.5 dex).
Cumulative mass fraction for the different kinematic tracers (i.e. k1, 2, kmass and klum) for below main-sequence galaxies (i.e. ΔMS < −0.5 dex) and main-sequence galaxies (i.e. ΔMS > −0.5 dex).
All Figures
|
Fig. 1. Distribution of the kinematic parameters. From left to right: normalised volume-weighted distributions of the k1, k2, klum (in turquoise), and kmass (in dark green) parameters. See Eqs. (1) and (2) for the definitions of klum and kmass. |
| In the text | |
|
Fig. 2. Two examples of galaxies (i.e. 8952-12704 top row, 9487-12705 bottom row) with low k1 and k2. From left to right: SDSS gri image, l.o.s. stellar velocity, and l.o.s. stellar velocity dispersion. The magenta hexagon is the MaNGA field of view. |
| In the text | |
|
Fig. 3. Two examples of galaxies (i.e. 7959-12703 top row, 9089-12704 bottom row) with low k1 and high k2. From left to right: SDSS gri image, l.o.s. stellar velocity, and l.o.s. stellar velocity dispersion. The magenta hexagon is the MaNGA field of view. |
| In the text | |
|
Fig. 4. Two examples of galaxies (i.e. 11946-12702 top row, 9090-12705 bottom row) with high k1 and high k2. From left to right: SDSS gri image, l.o.s. stellar velocity, and l.o.s. stellar velocity dispersion. The magenta hexagon is the MaNGA field of view. |
| In the text | |
|
Fig. 5. Comparison between the luminosity-weighted kinematic tracer klum (vertical axis) and a purely photometric bulge-to-total ratio taken from Domínguez Sánchez et al. (2022) (horizontal axis). The contours (grey lines filled with the blue shaded colours) are drawn at probability levels with a constant spacing of 0.1 while the black dots represent the data. The vertical arrow on the right side qualitatively explains the meaning of the klum parameters: a greater klum value corresponds to higher rotational support within the galaxy. |
| In the text | |
|
Fig. 6. Cumulative mass fractions depending on kinematics and star formation. Horizontal axes showing bins of stellar mass with the vertical axes showing the mass fraction as a function of different kinematic tracers (i.e. from top to bottom: klum, kmass and k1, k2). The colour-coding from red to blue indicates an increase in the rotational support. The left column refers to the whole sample, the middle column includes only below main-sequence galaxies (i.e. ΔMS < −0.5 dex) while the right column considers only main-sequence systems (i.e. ΔMS > −0.5 dex). The bottom legend shows the different thresholds x explicitly shown in the plot. |
| In the text | |
|
Fig. 7. Cumulative mass fraction integrated over the whole range of masses of klum (left, dashed line), kmass (middle, solid line) and k1, 2 (right, dotted line). Upward triangles show below main-sequence galaxies while the downward triangles refer to main-sequence galaxies. The three panels on the top row refer to the whole sample while the middle row differentiates between galaxies with M⋆ > 1011 M⊙ in red and galaxies with M⋆ < 1011 M⊙ in blue. The panel in the bottom row illustrates the difference between main-sequence and below main-sequence galaxies (i.e. Δk) for the whole sample as a function of k. |
| In the text | |
|
Fig. A.1. Two examples of galaxies (i.e. 11012-3701 top row, 10502-3702 bottom row) classified as ellipticals according to the VMC-VAC (Vázquez-Mata et al. 2022) with a clear rotational pattern. |
| In the text | |
|
Fig. B.1. Comparison between klum and λR. The blue dots are the data while the black dashed line is the one-to-one relation. For the comparison we consider λR estimates presented in (Fraser-McKelvie et al. 2021) corrected for inclination and seeing. |
| In the text | |
|
Fig. C.1. Two examples of galaxies (i.e. 9085-1902 top row, 11007-12705 bottom row) with high k1 and low k2. From left to right: SDSS gri image, l.o.s. stellar velocity, and l.o.s. stellar velocity dispersion. The magenta hexagon is the MaNGA field of view. |
| In the text | |
Current usage metrics show cumulative count of Article Views (full-text article views including HTML views, PDF and ePub downloads, according to the available data) and Abstracts Views on Vision4Press platform.
Data correspond to usage on the plateform after 2015. The current usage metrics is available 48-96 hours after online publication and is updated daily on week days.
Initial download of the metrics may take a while.