Fig. 5.
Download original image
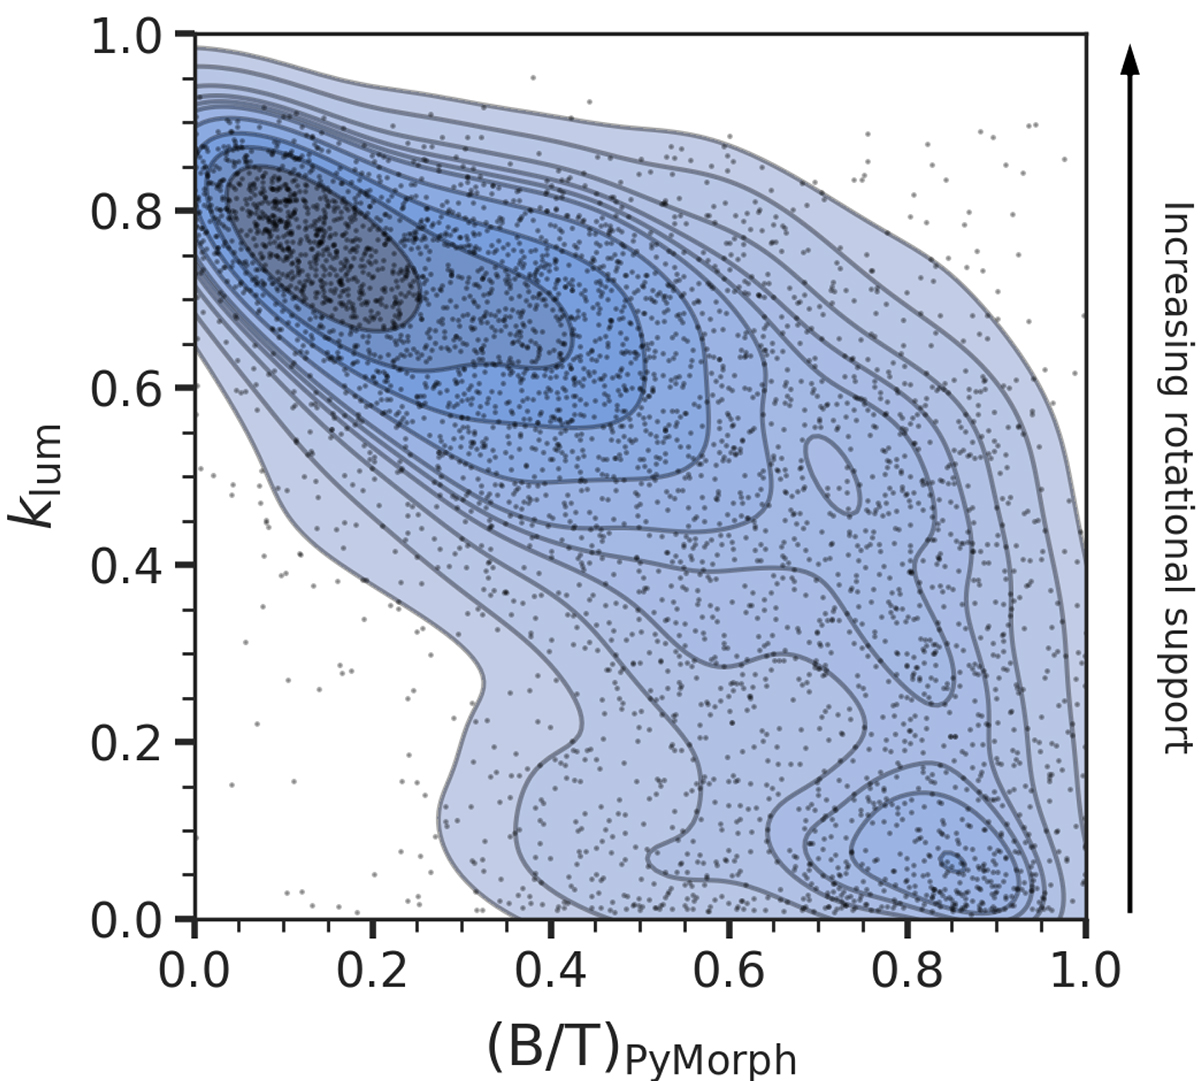
Comparison between the luminosity-weighted kinematic tracer klum (vertical axis) and a purely photometric bulge-to-total ratio taken from Domínguez Sánchez et al. (2022) (horizontal axis). The contours (grey lines filled with the blue shaded colours) are drawn at probability levels with a constant spacing of 0.1 while the black dots represent the data. The vertical arrow on the right side qualitatively explains the meaning of the klum parameters: a greater klum value corresponds to higher rotational support within the galaxy.
Current usage metrics show cumulative count of Article Views (full-text article views including HTML views, PDF and ePub downloads, according to the available data) and Abstracts Views on Vision4Press platform.
Data correspond to usage on the plateform after 2015. The current usage metrics is available 48-96 hours after online publication and is updated daily on week days.
Initial download of the metrics may take a while.