Fig. 6.
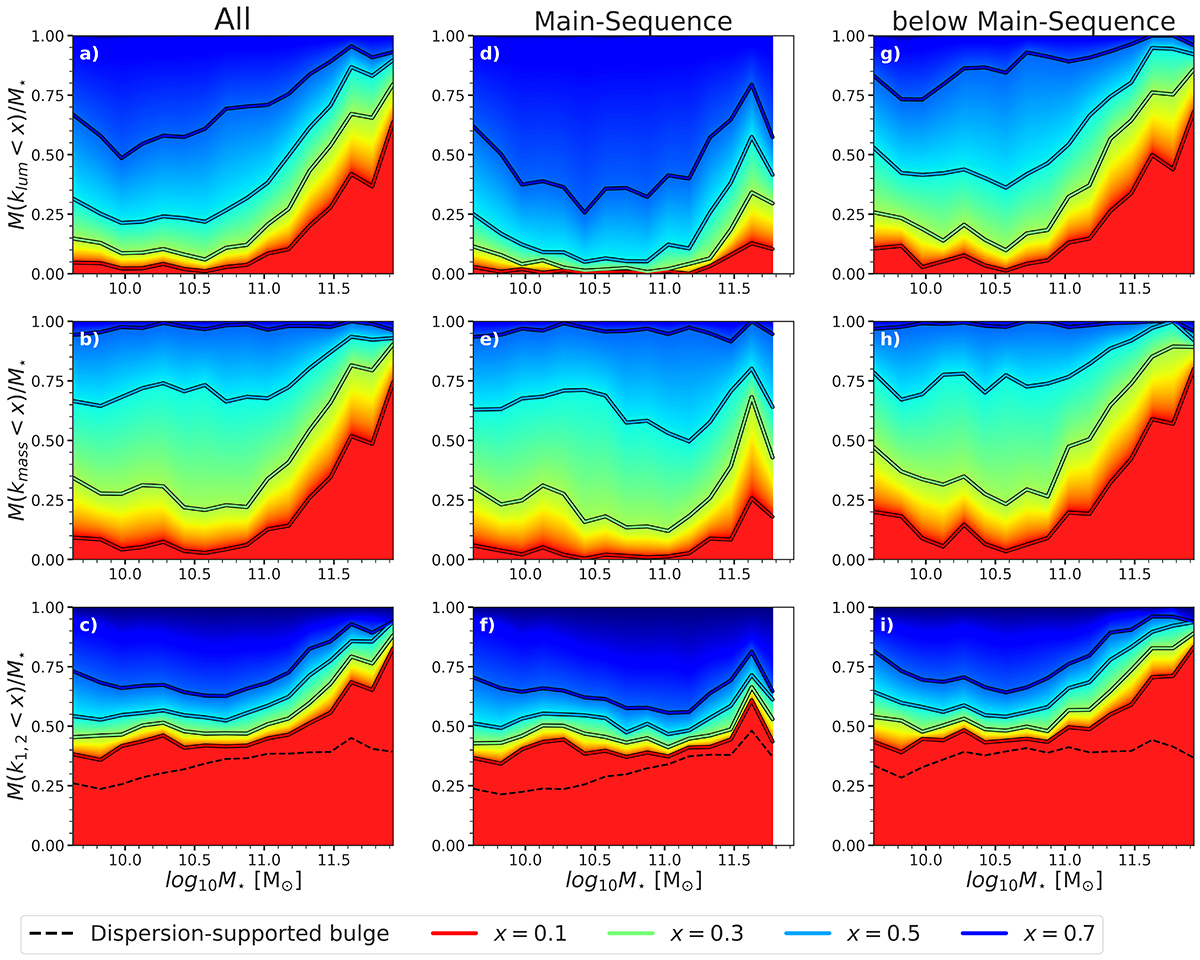
Download original image
Cumulative mass fractions depending on kinematics and star formation. Horizontal axes showing bins of stellar mass with the vertical axes showing the mass fraction as a function of different kinematic tracers (i.e. from top to bottom: klum, kmass and k1, k2). The colour-coding from red to blue indicates an increase in the rotational support. The left column refers to the whole sample, the middle column includes only below main-sequence galaxies (i.e. ΔMS < −0.5 dex) while the right column considers only main-sequence systems (i.e. ΔMS > −0.5 dex). The bottom legend shows the different thresholds x explicitly shown in the plot.
Current usage metrics show cumulative count of Article Views (full-text article views including HTML views, PDF and ePub downloads, according to the available data) and Abstracts Views on Vision4Press platform.
Data correspond to usage on the plateform after 2015. The current usage metrics is available 48-96 hours after online publication and is updated daily on week days.
Initial download of the metrics may take a while.