Fig. 3
Download original image
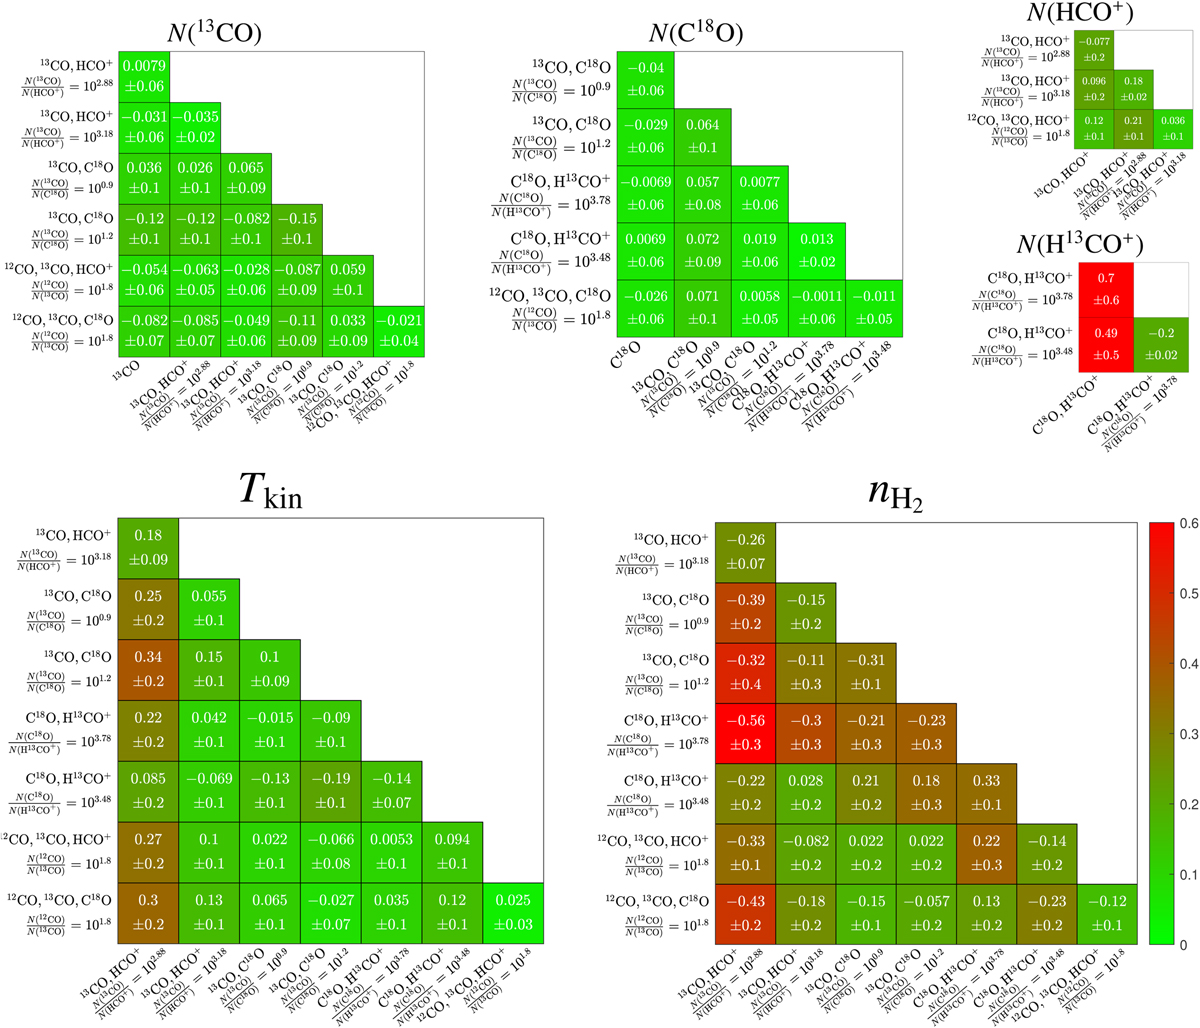
Mean and standard deviation of the distance in log-space between the estimations (i.e., ![]() where θ = log N, or log Tkin or log
where θ = log N, or log Tkin or log ![]() ) as a function of different sets of species and their associated a priori hypotheses, shown as the column and row labels. In all cases Tkin,
) as a function of different sets of species and their associated a priori hypotheses, shown as the column and row labels. In all cases Tkin, ![]() , CV and σV are assumed to be the same for all lines. Table 4 lists the details. The cells are color-coded with the values of the root mean square error
, CV and σV are assumed to be the same for all lines. Table 4 lists the details. The cells are color-coded with the values of the root mean square error ![]() . From left to right, the top graphs show the results for N(13CO), N(C18O), N(HCO+), and N(H13CO+), and the bottom graphs the results for the kinetic temperature and volume density. This figure summarizes the joint histograms shown in Figs. 2, C.1–C.4.
. From left to right, the top graphs show the results for N(13CO), N(C18O), N(HCO+), and N(H13CO+), and the bottom graphs the results for the kinetic temperature and volume density. This figure summarizes the joint histograms shown in Figs. 2, C.1–C.4.
Current usage metrics show cumulative count of Article Views (full-text article views including HTML views, PDF and ePub downloads, according to the available data) and Abstracts Views on Vision4Press platform.
Data correspond to usage on the plateform after 2015. The current usage metrics is available 48-96 hours after online publication and is updated daily on week days.
Initial download of the metrics may take a while.