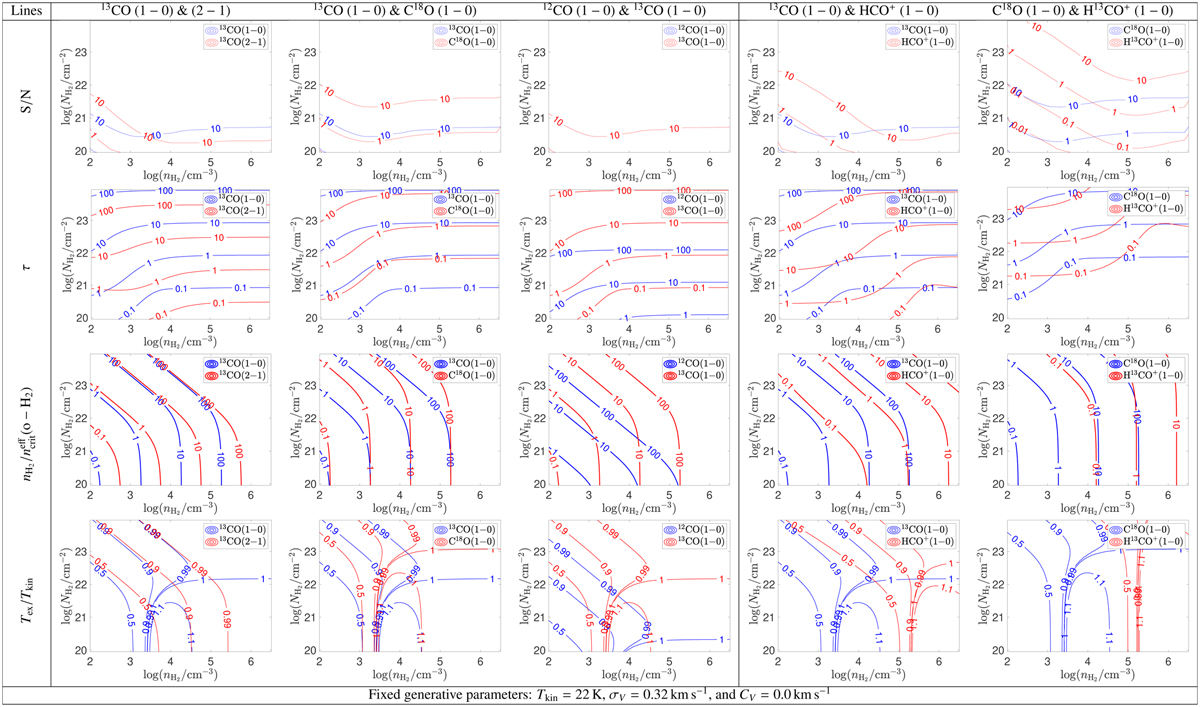
Fig. D.1
Download original image
Line main characteristics: S/Ns, opacities, ratios of the volume density to the effective critical densities, and ratios of the excitation and kinetic temperatures. The blue and red curves show the results for the (1 − 0) and (2 − 1) lines, respectively. The values of the parameters that are fixed when generating the RADEX spectra are listed in the bottom row, except for the abundances that are given in Eq. (16).
Current usage metrics show cumulative count of Article Views (full-text article views including HTML views, PDF and ePub downloads, according to the available data) and Abstracts Views on Vision4Press platform.
Data correspond to usage on the plateform after 2015. The current usage metrics is available 48-96 hours after online publication and is updated daily on week days.
Initial download of the metrics may take a while.