Fig. 2
Download original image
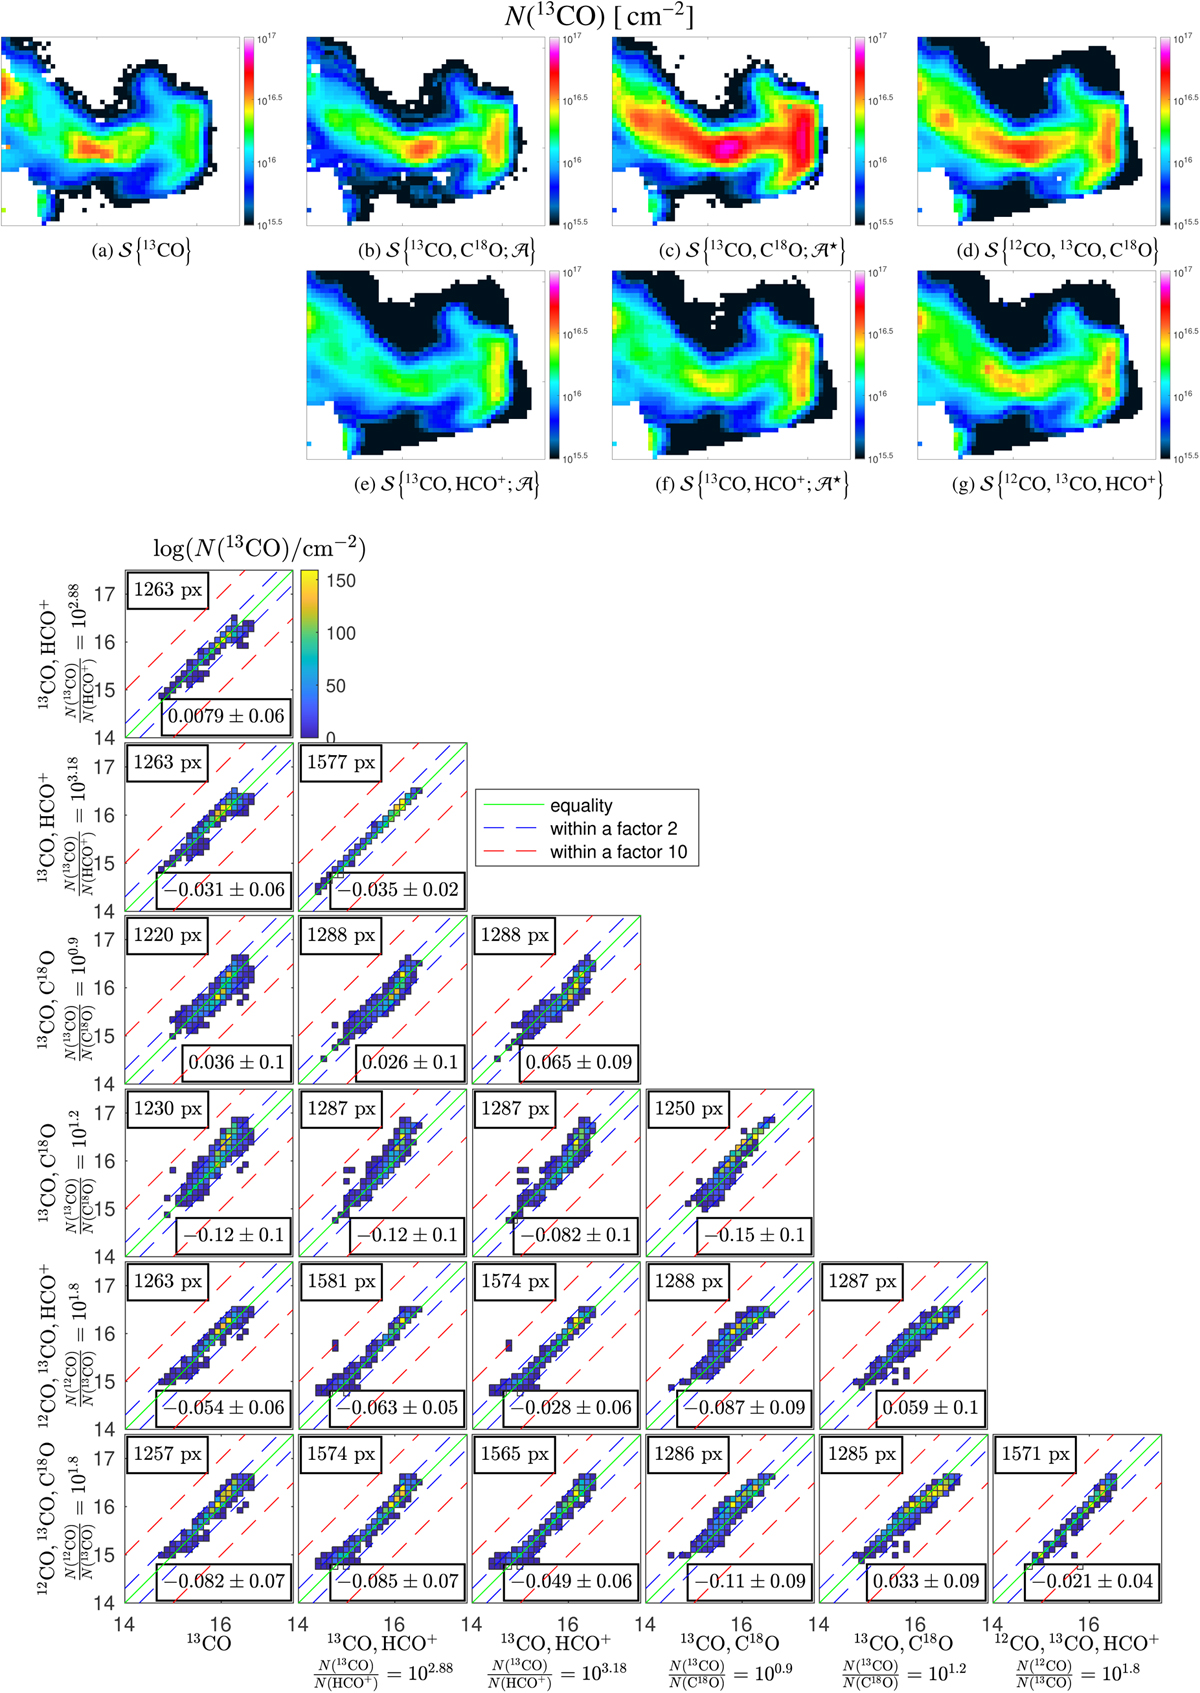
Comparison of the estimated column density of 13CO on the Horsehead pillar data for different sets of species and/or a priori. In all cases Tkin, ![]() , CV and σV are assumed to be the same for all lines. Top: maps of estimated N(13CO). Table 4 lists the details of each studied case. Bottom: joint histograms of log N(13CO) estimations as a function of different sets of species and there associated a priori hypotheses, shown as the column and row labels. In each panel, the green, blue, and red lines show the identity function, and ratios of values within a factor 2 or 10, respectively. The top left and bottom right legends give the number of pixels used to compute the histogram, and the mean and standard deviation of the distance to the green line.
, CV and σV are assumed to be the same for all lines. Top: maps of estimated N(13CO). Table 4 lists the details of each studied case. Bottom: joint histograms of log N(13CO) estimations as a function of different sets of species and there associated a priori hypotheses, shown as the column and row labels. In each panel, the green, blue, and red lines show the identity function, and ratios of values within a factor 2 or 10, respectively. The top left and bottom right legends give the number of pixels used to compute the histogram, and the mean and standard deviation of the distance to the green line.
Current usage metrics show cumulative count of Article Views (full-text article views including HTML views, PDF and ePub downloads, according to the available data) and Abstracts Views on Vision4Press platform.
Data correspond to usage on the plateform after 2015. The current usage metrics is available 48-96 hours after online publication and is updated daily on week days.
Initial download of the metrics may take a while.