Fig. 10
Download original image
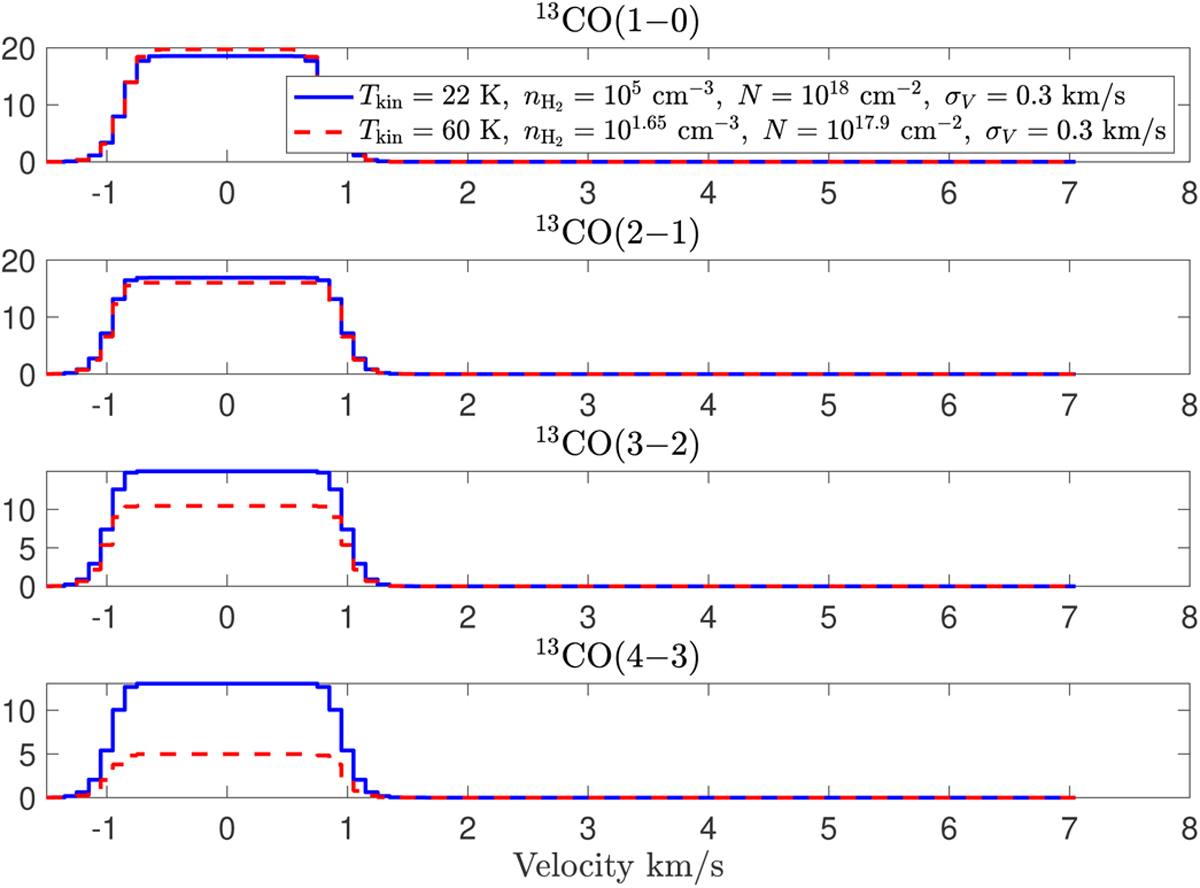
Comparison of the spectral shape of the (1 − 0) (top) to (4 − 3) (bottom) lines of 13CO for two different combinations of kinetic temperature, volume density, and column density. The plain blue and dashed red histograms show the spectra for (22 K, 105 cm−3,1018 cm−2) and (60 K, 101.65 cm−3, 1017.9 cm−2), respectively. The lines share the same centroid velocity CV = 0 km s−1 and velocity dispersion σV = 0.32 km s−1. The two sets of physical conditions deliver degenerate spectral profiles within the noise level for the (1 − 0) and (2 − 1) lines. Additional information, e.g., the (3 − 2) or (4 − 3) lines, is needed to lift this degeneracy.
Current usage metrics show cumulative count of Article Views (full-text article views including HTML views, PDF and ePub downloads, according to the available data) and Abstracts Views on Vision4Press platform.
Data correspond to usage on the plateform after 2015. The current usage metrics is available 48-96 hours after online publication and is updated daily on week days.
Initial download of the metrics may take a while.