Fig. 1
Download original image
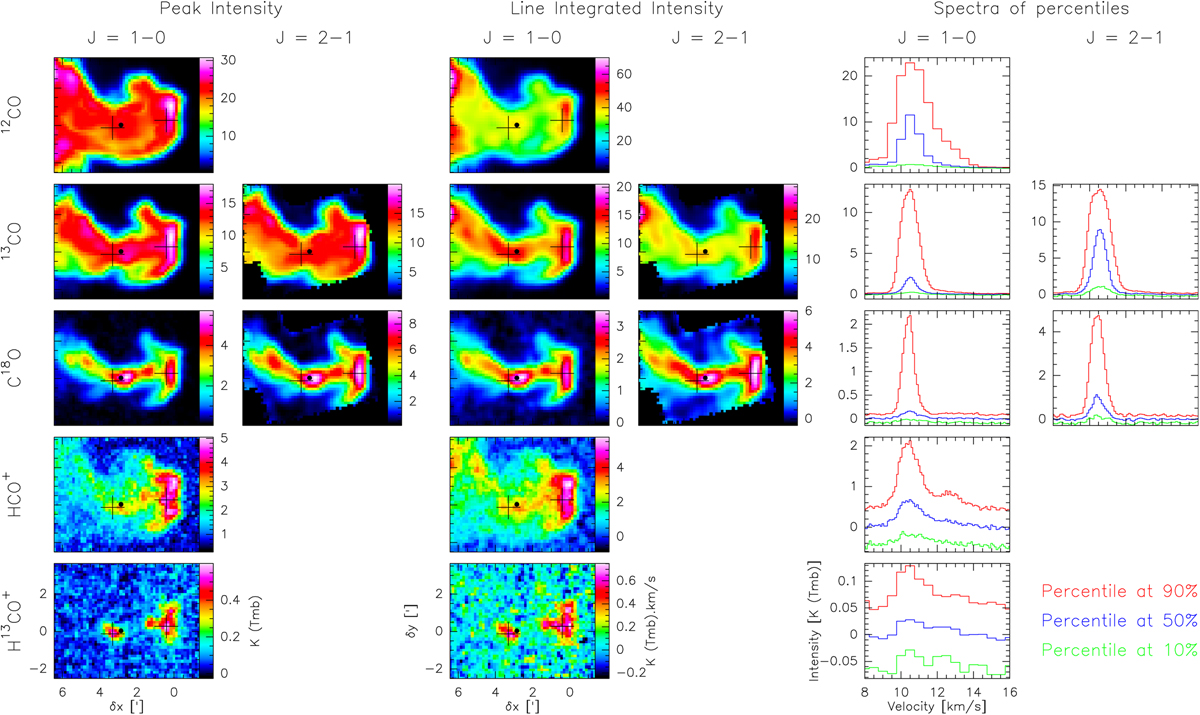
Presentation of the data towards the Horsehead pillar. Left and middle panels: spatial distribution of the peak intensity and of the integrated intensity. The used projection is the Azimuthal one, centered on RA= 05h40m54.27s, Dec= −02°28′00.00″ in the ICRS frame, and with a position angle of 14°. The two crosses show the positions of the two dense cores whose coordinates are in Table 3. The black dot shows the position of the line of sight studied in more detailed in Sect. 4. Right panel: the green, blue, and red spectra show the spectra of percentiles at 10, 50, and 90%, respectively, computed over the associated field of view.
Current usage metrics show cumulative count of Article Views (full-text article views including HTML views, PDF and ePub downloads, according to the available data) and Abstracts Views on Vision4Press platform.
Data correspond to usage on the plateform after 2015. The current usage metrics is available 48-96 hours after online publication and is updated daily on week days.
Initial download of the metrics may take a while.