Open Access
Fig. 4.
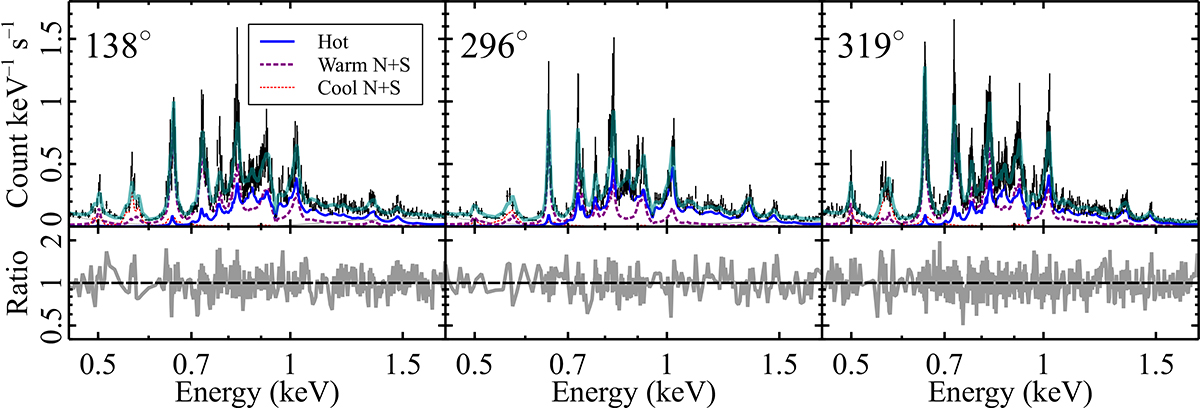
Download original image
Best-fitting models for the broadband RGS spectra of the centre of M 82 for the three position angles. The thin dotted and solid lines represent the background and point-source components, respectively (see Sect. 4.1).
Current usage metrics show cumulative count of Article Views (full-text article views including HTML views, PDF and ePub downloads, according to the available data) and Abstracts Views on Vision4Press platform.
Data correspond to usage on the plateform after 2015. The current usage metrics is available 48-96 hours after online publication and is updated daily on week days.
Initial download of the metrics may take a while.