| Issue |
A&A
Volume 690, October 2024
|
|
|---|---|---|
| Article Number | A9 | |
| Number of page(s) | 10 | |
| Section | Stellar structure and evolution | |
| DOI | https://doi.org/10.1051/0004-6361/202450101 | |
| Published online | 25 September 2024 | |
High-resolution X-ray spectra of the compact binary supersoft X-ray source CAL 87
1
School of Physics and Electrical Engineering, Liupanshui Normal University, Liupanshui, Guizhou 553004, China
2
Qiannan Normal University for Nationalities, Duyun 558000, China
3
Qiannan Key Laboratory of Radio Astronomy, Guizhou Province, Duyun 558000, China
4
Tsung-Dao Lee Institute, Shanghai Jiao Tong University, Shanghai 201210, China
Received:
23
March
2024
Accepted:
23
July
2024
Abstract
In this study we present an analysis of the archival X-ray data of the eclipsing supersoft X-ray binary CAL 87 observed with the Chandra Advanced CCD Imaging Spectrometer (ACIS) camera and Low Energy Transmission Grating (LETG) in 2001 August and with XMM-Newton in 2003 April. The high-resolution X-ray spectra are almost unchanged on the two different dates. The average unabsorbed X-ray luminosity during the exposure was 4.64 − 5.46 × 1036 ergs s−1 in 2001 and 4.54 − 4.82 × 1036 ergs s−1 in 2003, with prominent and redshifted emission lines, mostly of nitrogen, oxygen, iron, and argon, contributing to at least 30% of the X-ray flux. The continuum X-ray flux is at least an order of magnitude too low for a hot hydrogen-burning white dwarf (WD). However, the continuum flux is consistent with Thomson-scattering reflecting about 5% of the light of a hydrogen-burning WD with effective temperature of 800 000 K and a mass of ∼1.2 M⊙. It has been noted that a large Thomson-scattering corona explains the X-ray eclipse of CAL 87, in which the size of the eclipsed region is found to be on the order of a solar radius. The emission lines originate in an even more extended region beyond the eclipsed central X-ray source; the emission spectrum is very complex, with unusual line ratios.
Key words: binaries: eclipsing / white dwarfs
Corresponding author; This email address is being protected from spambots. You need JavaScript enabled to view it. .
© The Authors 2024
 Open Access article, published by EDP Sciences, under the terms of the Creative Commons Attribution License (https://creativecommons.org/licenses/by/4.0), which permits unrestricted use, distribution, and reproduction in any medium, provided the original work is properly cited.
This article is published in open access under the Subscribe to Open model. This email address is being protected from spambots. You need JavaScript enabled to view it. to support open access publication.
1. Introduction
CAL 87 is an eclipsing compact binary supersoft X-ray source (CBSS) in the Large Magellanic Cloud (LMC) that was discovered with the imaging proportional counter (IPC) of the Einstein Observatory (Long et al. 1981). The orbital period of CAL 87 is 10.6 hours (Callanan et al. 1989; Cowley et al. 1990; Schmidtke et al. 1993). CBSSs are characterized by blackbody-like spectra with temperatures ∼20 − 100 eV and X-ray luminosities ∼1035 − 1038 erg s−1 (Greiner 1996). van den Heuvel et al. (1992) suggested that the X-ray emission of CBSS is not transient or recurrent and cannot be associated with nova events. The luminous supersoft X-ray emission stems from stable nuclear burning on the surface of white dwarfs (WDs), which requires high mass-transfer (≳10−7 M⊙ yr−1) from the donor star in an interacting binary. In this model mass transfer is not permanently stable, and the burning is a recurrent phase in the evolution of a binary with a mass donor of higher mass than the WD. Mass transfer eventually becomes dynamically unstable, and there are cycles during which the WD’s envelope increases its radius to a red giant configuration.
Using the UV spectra, Hutchings et al. (1995) estimated that the disk bolometric luminosity is ∼1036 ergs s−1. Asai et al. (1998) and Ebisawa et al. (2001) interpreted the luminosity of the system as being due to the atmosphere of a WD undergoing stable hydrogen burning in shell, and tried to fit the broadband X-ray spectra observed by the ASCA Solid-State Spectrometer (SIS; Tanaka et al. 1994), which has an energy resolution of ΔE/E = ∼10% at 0.5 keV. Because of an eclipse in the X-rays, Ebisawa et al. (2001) were able to determine that the eclipsed region has to be on the order of magnitude of a solar radius in size, and concluded that what is detected in X-rays is Thomson scattered radiation in a corona surrounding a WD as the primary star, while the WD itself is never observed.
However, observations performed with the Chandra ACIS camera (Garmire et al. 2003) and the LETG (Davis 2008) in 2001, and later with the Reflection Grating Spectrometer (RGS; den Herder et al. 2001) of the European Space Agency’s X-ray Multi-Mirror Mission (XMM-Newton) observatory (Jansen et al. 2001) in 2003, surprisingly failed to detect a WD spectrum, and indicated that the X-ray flux is in large part due to emission lines that were not resolved with the CCD-type instruments used earlier. Greiner et al. (2004) suggested that the LETG spectra are due to a recombination component and a resonant scattering component, and are formed by a hidden ionizing central source that they inferred to have an absolute unabsorbed luminosity of ∼5 × 1037 ergs s−1 and an effective temperature in the ∼50 − 100 eV range. Orio et al. (2004) identified the emission lines in the spectra of XMM-Newton RGS data, and based on the redshift of the lines (700 − 1200 km s−1), they suggested that these lines originated from a wind. However, these articles were two short conference presentations, and no quantitative models of the grating spectra followed. Ness et al. (2013) classified Cal 87 and U Sco as a subclass of super-soft-source (SSS) called the SSe class. In this class, the X-ray spectrum features a weak blackbody-like continuum without absorption lines, and the emission lines are at least as strong as the continuum. Moreover, the emission lines in the SSe class are strongest where the continuum is most intense. Tsujimoto et al. (2024) fitted the spectra of XMM-Newton data by using a corona model based on the radiative transfer of the corona surrounding the WD atmosphere plus a collisionally ionized plasma model, while the energy ranges of 0.565−0.569 keV (21.790−21.944 Å) and 0.715−0.740 keV (16.755−17.341 Å) was ignored in their final fitting.
Orio et al. (2004) found that the eclipse is energy dependent, and is deeper at lower energy. Using the XMM-Newton data, Ribeiro et al. (2014) studied the X-ray eclipse geometry of CAL 87 in the XMM-Newton data. They found that the continuum emission dominates the decrease in flux during eclipses, and that the emission lines are not eclipsed and originate in a more extended region. While an eclipse model is also shown in Ebisawa et al. (2001), these authors assumed that the Thomson scattering corona is eclipsed by the secondary blocking the supersoft X-ray light. Ribeiro et al. (2014) suggested instead that an accretion disk with an asymmetric feature eclipses the source of the continuum supersoft radiation. Ness et al. (2013) also suggested that when viewed edge-on, the accretion disk blocks the central hot source; however, Thomson scattering allows the continuum emission to remain visible even during the total obscuration of the central hot source. The optical eclipse, shifted in phase by 3% (Orio et al. 2004) was explained by Schandl et al. (1997) as being due to a secondary star more massive than the compact object, eclipsing the accretion disk, which also has an asymmetric hot spot where the mass inflow impinges the disk, producing a nonsymmetric light curve in ingress and regress.
CAL 87 is an eclipsing source in optical and X-rays, with an inclination larger than 70°, but measuring the mass of the binary components has not been possible so far. Recent papers tend to disregard the van den Heuvel et al. (1992) arguments in favor of recurrent stable mass transfer with a more massive secondary than the compact object (a G to F star of ∼1.5 M⊙ mass), as well as the possibility of a different compact object than a WD. Ribeiro et al. (2014) favor a low-mass secondary (of less than 1 M⊙ and lower mass than the WD) and find evidence that the most likely values of the inclination i and mass ratio are i = 82° and q = 0.25.
For this work we reanalyzed previously published data obtained with Chandra (Greiner et al. 2004) and XMM-Newton (Orio et al. 2004; Ness et al. 2013; Ribeiro et al. 2014; Tsujimoto et al. 2024). The X-ray spectra of CAL 87 are complex, and the obtained high-resolution X-ray spectra of CAL 87 are precious and with features that could be used to sensibly constrain models. However, previous attempts at spectral modeling for these high-resolution X-ray spectra were not successful. Our aim is to explore the high-resolution X-ray spectra of CAL 87 to identify models that can adequately fit the data. Our findings indicate that an atmospheric model combined with a collisional plasma model can fit the blackbody-like continuum and some of the emission lines in the X-ray spectra of CAL 87. We present a brief introduction of CAL 87 in Sect. 1. We describe the details of the observations and briefly recall the data reduction process in Sect. 2. We present a detailed analysis of the grating spectra in Sect. 3. Our findings are discussed in Sect. 4, and we summarize our conclusions in Sect. 5.
2. Observation and data reduction
CAL 87 was observed with the ACIS and LETG instruments of Chandra on 2001 August 13–14, for nearly 100 ks, covering two full orbital cycles and three eclipses (PI: Greiner; ID: 1896). We extracted the Chandra first-order spectrum and zero-order light curve with Chandra Interactive Analysis of Observation (CIAO; Fruscione et al. 2006) v4.121 using the calibration files CALDB v4.9.0, and all the standard procedures of data reprocessing and reduction in CIAO science threads were used.
CAL 87 was also observed with all the XMM-Newton instruments: the RGS1, the RGS2, the European Photon Imaging Camera-pn (EPIC-pn; Strüder et al. 2001), the EPIC-Metal Oxide Semi-conductor 1 (MOS1), the EPIC-MOS2 (Turner et al. 2001), and the Optical Monitor (OM; Mason et al. 2001) on 2003 April 18–19 for nearly 80 ks, covering two orbital cycles and two eclipses (PI: Ebisawa; ID: 0153250101), as shown in Fig. 1. The XMM-Newton data reduction was performed using the Science Analysis System (SAS) version 20.0.0 package and current calibration files (CCF). We extracted the RGS1 and RGS2 grating spectra using the updated calibration files, and all the standard procedures of data reprocessing and reduction in the SAS data analysis threads. We co-added and averaged the two background subtracted grating spectra with the SAS task RGSCOMBINE.
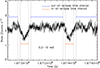 |
Fig. 1. Light curve of XMM-Newton EPIC-pn observation of CAL 87 at 0.2−10 keV, binned with 200 s per bin. The blue lines show the time intervals in which we extracted the out-of-eclipse spectra, and the blue lines show the time intervals in which we extracted the in-eclipse spectra. For the comparison we neglected the spectrum observed in a 2100 s interval at the beginning and end of the eclipses. |
We used XSPEC v. 12.12.1 (Arnaud 1996; Dorman et al. 2003) to fit the spectra. For the regions below 13 Å and above 34 Å the signal-to-noise ratio of the background subtracted spectra is very low, so we used the 13−34 Å range to perform the spectral analysis.
3. Spectral analysis
Spectral fits of the high-resolution X-ray spectra yield precious information on the nature of the system, but the high-resolution X-ray spectra CAL 87 are complex. A fit was attempted in a short paper by Ebisawa et al. (2010); they found that in addition to the plasma where the emission lines originate, the hot continuum corresponding to a WD is needed to explain the spectra, and they also noted that the WD continuum must be scattered by the accretion disk corona (ADC) into the line of sight. Ribeiro et al. (2014) focused on mapping the eclipse, and they found that the emission lines must come from an extended region.
Since the intensities of emission lines in the Chandra and XMM-Newton spectra do not show significant changes during or out of the eclipses (Ribeiro et al. 2014), we fitted the spectra of the entire exposures. We also estimated the flux and determined the measured wavelengths of emission lines by using one or two Gaussian models (AGAUSS in XSPEC) to fit their profiles, with a simple power law model to describe the continuum around the short energy range of each line, and we determined the errors by using the error command in XSPEC. The identified emission lines and the flux, when measurable, are listed in Table 1 and labeled in Fig. 2. The intercombination and forbidden lines of the O VII triplet in the spectra of XMM-Newton data are too weak, so we could not estimate the errors in measuring the central wavelengths. The N VI emission line in the spectra of Chandra data is too weak to calculate its flux. We also compared the Chandra fluxes and spectra with those of XMM-Newton, and we found that there are some small differences, so we fitted the spectra of Chandra data and XMM-Newton data separately.
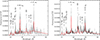 |
Fig. 2. Chandra LETG spectrum (left) and averaged XMM-Newton RGS spectrum (right) of CAL 87, fitted with an atmosphere model and a collisional ionization plasma model. The characteristics and parameters are given in Table 2. The fit is shown as the red solid line. |
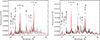 |
Fig. 3. Chandra LETG spectrum (left) and averaged XMM-Newton RGS spectrum (right) of CAL 87, fitted by using an atmosphere model and a nonequilibrium ionization collisional plasma model. The characteristics and parameters are given in Table 2. The fit is shown as the red solid line. |
Fitting results for the emission lines.
We obtained the best fits by combining the TMAP atmospheric model with galactic halo abundances developed by Rauch et al. (2000) with a plasma in collisional ionization equilibrium (CIE, BVAPEC model in XSPEC, Smith et al. 2001) or by adding the TMAP model with galactic halo abundances to a plasma that is not in CIE (VNEI model in XSPEC, Borkowski et al. 2001). Neither model can explain all the lines and the unusual line ratios of Fe XVII. The best-fit parameters of these models are shown in Table 2, and the errors were estimated by using the error command in XSPEC. The parameters for the best fits obtained with the CIE and atmospheric components (Model 1) for both the XMM-Newton and Chandra spectra are listed in Table 2. Additionally, the parameters obtained with the nonequilibrium (NEI) model and atmospheric component (Model 2) are also included in Table 2. The fits to the spectra using an atmospheric model combined with a collisional ionization plasma model are shown in Fig. 2, while the fits using an atmospheric model combined with a nonequilibrium ionization collisional plasma model are shown in Fig. 3. The table also gives the 90% confidence level uncertainties. In the BVAPEC and VNEI models, the abundances of Fe, O, Ar, and N are set as free parameters. However, since these abundances are not well constrained in the fits of the best models, we do not include their values in Table 2. We attempted to add more components to Model 1 and Model 2, such as a second component for the continuum and/or another region at different plasma temperature, but the fits to the spectra did not significantly improve. For instance, the fits for the XMM-Newton spectra yielded smaller reduced χ2 values (1.96 for Model 1 and 2.01 for Model 2) when an additional atmospheric component was added, though the changes in the fits are hardly noticeable to the naked eye. The fit for the XMM-Newton spectra yielded a reduced χ2 value of 1.95 when an additional BVAPEC model was added to Model 1, with only a marginal improvement in the 26−27 Å range. Similarly, the fit yielded a reduced χ2 value of 1.99 when an additional VNEI model was added to Model 2, with only marginal improvement in the 26−28 Å range. In both cases several other emission features remain unaccounted for.
Best-fit parameters to the spectra of CAL 87.
As shown in Table 2, the unabsorbed X-ray flux of CAL 87 in the 0.2 − 1 keV range with the CIE plasma and atmospheric model turns out to be 20.0 erg cm−2 s−1 and 21.5
 erg cm−2 s−1 for the Chandra and XMM-Newton spectrum, respectively, and the emission lines contribute to at least 30% of the X-ray flux. The absolute X-ray luminosity of CAL 87 in the 0.2 − 1 keV range with the CIE plasma and atmospheric model turns out to be 4.64
 erg s−1 and 4.54
 erg s−1 for the Chandra and XMM-Newton spectrum, respectively. Assuming the nonequilibrium collisional plasma component and the atmospheric component, the X-ray luminosity turns out to be higher by several percent, 5.46
 erg s−1 and 4.82
 erg s−1 for Chandra and XMM-Newton, respectively. The absolute X-ray luminosity of CAL 87 in the 0.2 − 1 keV range constitutes ∼95% of the bolometric luminosity.
The atmospheric models developed by Rauch et al. (2000) represent a good approximation to the atmosphere of a hydrogen-burning WD, and including a grid of effective gravity values, with a log(g) grid ranges from 5 to 9 with one step increments. We do not have sufficient spectral leverage in our data to constrain the atmospheric continuum. Because the level of the continuum flux is much lower than that of a hydrogen-burning WD, the flux is not a limit that allows us to properly simultaneously constrain two parameters, log(g) and Teff. Moreover, because we do not detect absorption features, and have an overlap of the prominent emission lines, it is not possible to determine a suitable value of log(g) between values log(g) = 6 and log(g) = 9 because the WD luminosity and radius depend on the amount of N(H) that we assume. The hydrogen column density obtained in our fits is consistent with the value in the direction of CAL 87 that is 3.42 × 1021 cm−2 indicated by HI4PI Collaboration (2016). We do obtain one important constraint by fitting the atmospheric model, that Teff should be ∼800 000 K for any log(g). We calculated that, with log(g) as low as 6, we would have a very bloated radius with respect to a WD in hydrostatic equilibrium (7.5 × 109 cm to 1010 cm). Model calculations show that at such high Teff the radius has to be sufficiently small for the WD to remain in hydrostatic equilibrium, so with log(g)≤8, the WD would actually be undergoing a nova outburst (e.g., Starrfield et al. 2012). The only stable configuration is obtained by assuming a radius close to that of a stable WD with Teff ≃ 800 000 K, which constrains log(g) to be close to 9. The putative WD would have Teff consistent with a WD mass of about 1.2 M (Wolf et al. 2013). The unabsorbed X-ray luminosity inferred from our spectral fits is very low compared to a hydrogen-burning WD with effective temperature of 800 000 K, and a mass of ∼1.2 M⊙, which implies that the continuum flux is attributed to a Thomson scattering corona. The amount of Thomson reflected flux of the WD would be about 5% for log(g) = 9. An eclipsed Thomson scattering corona around a WD was also suggested in Nova U Sco (Ness et al. 2012; Orio et al. 2013), where the amount of reprocessed radiation in different observations was 10% to 20%. The inference that the WD radiation was scattered was also suggested for Nova HV Cet (Beardmore et al. 2012) and Nova Monocerotis 2012 (Page et al. 2013).
4. Discussion
The emission lines are broadened, probably because the emission region is extended, and they are redshifted. The O VII He-like triplet can be used as a diagnostic to constrain the plasma. In the Chandra spectrum we observe only the strong resonance line; the forbidden and intercombination lines are absent in the Chandra spectrum, but the other lines of the triplet are measurable in the RGS spectrum, as shown in Fig. 4. This is due to the smaller collecting area of the Chandra LETG+ACIS setup with respect to the RGS1 and RGS2 on XMM-Newton. ACIS and the LETG receive a lower photon count than the RGS1 and RGS2.
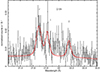 |
Fig. 4. O VII He-like triplet, unbinned, as measured in the averages RGS1 and RGS2 spectra of CAL 87, (black data points), and a fit with Gaussians for the lines, and a power law for the continuum (red solid line). |
Depending on the plasma temperature and specific element, the G ratio indicates whether the plasma is in CIE, G = (f + i)/r, where r, i, and f are respectively the fluxes in the resonance, intercombination, and forbidden lines of the He-like triplets, and another useful index of the plasma property is R = f/i, which is the sensitive indicator of electron density. Generally, G > 4 indicates a contribution of photoionization (Bautista & Kallman 2000; Porquet et al. 2001) as long as this diagnostic is used in a regime where the forbidden line is not sensitive to the density, that is to extremely high densities. For the O VII He-like triplet, we measured G = 0.78 ± 0.35 and R = 1.57 ± 1.23. Even taking into account the errors in the measurement, as we see in Fig. 4, the r line is stronger than the other two of the O VII He-like triplet, so the G ratio value is much lower than 4. These diagnostics point away from a photoionized plasma, and possibly toward a plasma in CIE. The value of the R ratio of the O VII He-like triplet, corresponds to the electron density ne ∼ 4 × 1010 cm−3Porquet & Dubau (2000).
However, the spectrum may be more complex and the plasma may not be in CIE. For the Chandra spectrum, the nonequilibrium collisional plasma component gives a slightly better fit than the CIE plasma, but the opposite is true for the XMM-Newton spectrum. There are astrophysical phenomena in which nonequilibrium ionization is indeed thought to occur: supernova remnants (Gronenschild & Mewe 1982; Masai 1994), the outskirts of galaxy clusters, the inner part of galaxy clusters (Akahori & Yoshikawa 2008; Prokhorov 2010).
Another puzzle in the spectra of CAL 87 is due to an apparently very unusual line ratio in two Fe-L lines. The observed Fe XVII I(15.01 Å)/I(15.26 Å) line ratio is 0.70−0.80, which is higher than the values in the theoretical calculations, in the experiments, and in astrophysical sources, as shown in Table 3. Fe-L lines are very common in the X-ray emission line spectra of novae and other SSSs. They are basically a complex assembly of n ≥ 3 to n = 2 transitions of Fe ions in different ionization states, affected by a range of atomic processes such as collisional excitation, resonant excitation, radioactive recombination, dielectronic recombination, and inner-shell ionization. These lines are often very bright, and are frequently used as diagnostics of electron temperature (e.g., Smith et al. 1985), electron density (e.g., Phillips et al. 1996), and chemical abundances (Werner et al. 2006; de Plaa et al. 2017).
Ratio of the relative intensity of Fe XVII emission lines at 15.014 and 15.261 Å (I(15.01 Å)/I(15.26 Å), also labeled as I3C/I3D).
The rich science of Fe-L has motivated many studies, in particular for Fe XVII. The L-shell line emission spectrum of Fe XVII is observed over a large temperature range. Two of the strongest, most distinct lines are the (1s22s22p1/253d3/2)J = 1 → (1s22s22p6)J = 0 resonance and (1s22s22p3/253d5/2)J = 1 → (1s22s22p6)J = 0 intercombination line at 15.014 and 15.261 Å, respectively (commonly labeled 3C and 3D). As Fig. 2 shows, we tentatively identified these two lines as such. These lines are measured respectively at 15.32 Å in the Chandra spectrum and 15.29 Å in the XMM-Newton spectrum, and at 15.08 Å in Chandra and 15.05 Å in XMM-Newton. Considering the uncertainties in wavelength or velocity, we further investigated the uniqueness of this identification. We note that there are no other known emission lines in this wavelength region with sufficient intensity to match these two observed lines, but these lines could be due to a range of nearby ionization states. However, there remains a possibility that the line observed at 15.29 Å and 15.32 Å represent a new as-yet-unidentified line. This topic will be revisited later in the text. In the literature there is some uncertainty in the ratio of the relative intensity of these two Fe XVII emission lines, and we summarize the published results for the line ratios in Table 3. The ratios of the lines can completely change if the plasma density is above a critical density that is a few × 1013 cm−3 or the photoexcitation temperature is above 55 kK (Mauche et al. 2001). We do not, however, reach a clear conclusion of whether this high plasma density or high photoexcitation temperature regime described by Mauche et al. (2001) encompasses the 0.7−0.8 values of the Fe XVII I(15.01 Å)/I(15.26 Å) line ratio we have observed.
Despite the uncertainties, the 3C line in the theoretical calculations, in the experiments, and in astrophysical sources has always been found to be stronger than the 3D, unlike in our case: we measure a ratio 0.70−0.80. This was found also by Greiner et al. (2004), who attributed it to recombination emission. There may be different explanations for this puzzle. First of all, the contamination of the 3D (λ0 = 15.261 Å) line by an Fe XVI satellite line can further reduce the value of the ratio, especially in colder plasmas (below ∼3 MK) (Phillips et al. 1997; Brown et al. 2001). As shown in Table 2, our spectral fitting results show that the plasma temperature is in the range of 0.22−0.25 keV (corresponding to 2.55−2.90 MK). Consequently, the unusually low ratio observed in CAL 87 may be due to an Fe XVI satellite line coinciding with the 3D line. Behar et al. (2001) also found that the attenuation of the ratio measured in Capella may be due to the blending of the Fe XVII (λ0 = 15.261 Å) line with a strong Fe XVI line (λ0 = 15.262 Å measured at 15.264 Å in the spectra of Capella) that can contribute to about 10% of the total intensity.
Another reason may have to do with unusually high density. Mauche et al. (2001) found that the Fe XVII I(17.10 Å)/I(17.05 Å) line ratio (which we cannot measure for CAL 87), observed in the Chandra HETG spectrum of the intermediate polar (IP) EX Hya is 0.05 ± 0.04, which is significantly lower than 0.93 ± 0.11 observed in the Sun. However, they found that the line ratios of all other lines [I(15.01 Å)/I(16.78 Å), I(15.26 Å)/I(16.78 Å), I(17.05 Å)/I(16.78 Å), and I(15.01 Å)/I(15.26 Å)] (thus including the 3C and 3D line ratio) in EX Hya and the Sun are consistent with each other, as shown in Table 3. These authors found that the significantly low value of the I(17.10 Å)/I(17.05 Å) line ratio observed in EX Hya can be explained if the plasma density n ≥ 2 × 1014 cm−3, which is orders of magnitude greater than that observed in the Sun or other late-type stars. Although there are no calculations for the relative intensity of the 3C and 3D Fe XVII lines, the fact that there is a critical density above which the ratio of the lines may completely change is well established (Beiersdorfer et al. 2004).
We note that the two lines are also measured with the same unusual ratio we found in Table 1 in the grating spectra of another SSS, MR Vel (Bearda et al. 2002). If our line identification is correct, given that even a density n ≥ 2 × 1014 cm−3 did not skew the ratio of these lines in EX Hya, this unusual measurement may be due to the Fe XVII line at 15.261 Å being blended with a stronger than usual Fe XVI line at 15.262 Å. However, we also do not rule out that we did not measure the 3D line and that this is instead a new, still unidentified line. We think that new calculations and experiments for the L-shell line emission spectrum of Fe XVII may still be needed. Furthermore, the ratio of Fe XVII at 16.78 Å and the lines at 17.05 Å is also unusually low. This was noted also by Greiner et al. (2004), who attributed it to recombination emission. All the iron lines we could identify have very unusual ratios and are not consistent with a CIE plasma.
There is another interesting finding: a possible narrow absorption line inside the broadened emission lines of O VIII Lyα and N VII Lyα in the Chandra spectra, but not in the XMM-Newton spectra. Figure 5 shows this finding in the emission line of O VIII Lyα as an example illustrating how the line profile can be interpreted as having an embedded absorption core at the center of the line. As shown in Fig. 5, we can clearly see the absorption in the residual of O VIII Lyα region in Chandra spectra, and this feature is not present in the residual of O VIII Lyα region in the XMM-Newton spectra. The narrow absorption lines inside the broadened emission lines of O VIII Lyα and N VII Lyα in the Chandra spectra are present during and out of the eclipses. The longer wavelength part of the emission line O VIII Lyα (in the right side of the absorption core which is at ∼18.96 Å in Fig. 5) in the Chandra spectra has a clearly double-peaked profile in the 19.0−19.1 Å range; this double peaked profile was also found by Greiner et al. (2004). We refer to this double-peaked profile in the rest text. For the narrow absorption line inside the broadened emission line, the dip reached down to < 20% of the flux of the peak on the left-hand side, and an apparent inverted Gaussian profile can be observed in the same region as the narrow absorption line in the residuals when fitting the spectra with a Gaussian for the line and a power law for the continuum, as shown in Fig. 5. In contrast, for the double-peaked profile, the dip dropped to > 80% of the flux of the left-hand peak, and no apparent inverted Gaussian profile is present in the same region as the double-peaked profile in the residuals when using the same fitting method. As we know, the spectral resolution of the RGS is less than ACIS+LETG, but double-peaked profiles were detected in the broadened emission lines of O VIII Lyα of Chandra spectra and XMM-Newton spectra (Greiner et al. 2004; Ribeiro et al. 2014), and these double-peaked profiles are finer structures than the narrow absorption line inside the broadened emission line of O VIII Lyα; therefore, the lower spectral resolution of the RGS should be not the reason that there are no absorption lines in the broadened emission lines of the XMM-Newton spectra. These absorption lines are at their rest wavelengths (unshifted). We suggest that there was some rest and transient material outside of the emitting region of the emission lines.
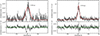 |
Fig. 5. O VIII Lyα region in Chandra spectra (left) and XMM-Newton spectra (right) of CAL 87, and a fit, shown as the red solid line, using a Gaussian for the line and a power law for the continuum. The residuals are shown in the panel below each plot. The residuals show how the line profile in Chandra spectra can be interpreted as having an embedded absorption core at the center of the line, rather than as double-peaked profiles. |
The emission lines in the Chandra spectra are clearly broad and redshifted with velocities in the range from 540 to 2060 km s−1 (see Table 1). The emission lines in the XMM-Newton spectra of 2003 are also broad and redshifted with velocities in the range from 261 to 1330 km s−1, as shown in Table 1, mostly less redshifted than the corresponding emission lines in the Chandra spectra of 2001. As shown in Table 2, the resulting average redshift for the emission lines in the Chandra spectrum is  × 10−3 (corresponding to 1109
 km/s) in the first model and
  × 10−3 (corresponding to 1052
 km/s) in the second. The average redshift resulting from the fit to the XMM-Newton spectra is
  × 10−3 (corresponding to 809
 km/s) and
  × 10−3 (corresponding to 824
 km/s) for each of the two models. They are also broadened by about 750 km s−1 in the LETG spectrum and by about 500 km s−1 in the RGS spectrum. The stronger emission lines in CAL 87 are observed at wavelengths where the continuum is more intense, indicating photoexcitation as a part of the resonant line scattering (Ness et al. 2013).
The significant redshift was interpreted by Greiner et al. (2004) as implying that the emission lines emanate in a wind. If we could observe all parts of a spherically symmetric wind, we would observe broadened lines centered on the systemic velocity. If the outflow were due to an almost point source, the blueshifted portion of the wind coming toward the line of sight would be negligible compared to the redshifted outflow. However, Greiner et al. (2004) found that the wind may also come from an extended accretion disk. They also found that the O VIII line at 18.97 Å in the Chandra spectrum has a clearly double-peaked profile, but the red peak disappears during the eclipse. This can be interpreted and modeled as an outflow in a bi-directional cone of an accretion disk corona, with an opening angle of about 120° (Greiner et al. 2004).
The phase duration of the eclipse is 0.3 (see Fig. 1), implying that the radius of the eclipsed source is much bigger than the radius of the WD. The eclipsed source should have about the same size as the occulter (Greiner et al. 2004), assuming that the secondary star is filling its Roche lobe and the radius of the eclipsed source is about 1.4 R⊙. Since the orbital period is 10.6 hours, the effective temperature from our best spectra fitting implies that the mass of the WD is around 1.2 M⊙. If the mass of the secondary is around 0.4 M⊙ (Hutchings et al. 1998), using Kepler’s law the binary separation is about 2.9 R⊙ and the radius of the Roche lobe is calculated following Eggleton (1983). Thus, the eclipsed source is far too extended to be a compact object. Since the flux of the emission lines does not decrease during the eclipse, they may originate in this extended region that is outside of the eclipsed region (∼1.4 R⊙).
A similar result was obtained for the size of the emission region (∼1.5 R⊙) by Greiner et al. (2004), even if these authors assumed that the mass of the WD is only 0.75 M⊙ and that the secondary is more massive. The continuum component in the CAL 87 spectra is produced by the WD’s photosphere Ness et al. (2013). The fact that the continuum component is not totally eclipsed (Ribeiro et al. 2014) implies that part of the continuum flux also originates outside the eclipsed source. Therefore, as in the recurrent Nova U Sco, an extended corona around the WD, most likely due to Thomson scattering, is needed to explain the X-ray spectra of CAL 87. Thomson scattering scatters the emission in a large volume without changing the spectrum. Ness et al. (2013) also suggest that the emission lines originate from the reprocessed emission far from the WD in the wind.
The TMAP component in the spectral fit indicates that the effective temperature of CAL 87 is around 800 000 K. However, the effective temperature of RS Ophiuchi is also around 800 000 K, but the X-ray luminosity of CAL 87 is ∼5 × 1036 ergs s−1 in the 0.2 − 1 keV range, which is a factor of 18 smaller than the X-ray luminosity in the same range measured in RS Ophiuchi (Nelson et al. 2008). This further suggests that we do not observe the WD directly in CAL 87 and most of the emission is blocked by the accretion disk. The reprocessing factor of the WD radiation should be on the order of 10%. This is consistent with the very high inclination angle (Meyer-Hofmeister et al. 1997; Oliveira & Steiner 2007; Ribeiro et al. 2014).
The spectra of CAL 87 are different from the spectra of other SSS such as CAL 83 because of the lack of strong absorption lines. The flux in the observed energy range (0.2 − 1 keV) is very low for an SSS in the LMC (Kahabka & van den Heuvel 2006), while the fluxes of the emission lines are unusually high for a system that does not have any trace of a recent nova shell at optical wavelengths (Ness et al. 2013). However, as shown in Fig. 6, we found that the spectra of CAL 87 are similar to the spectra of one particular nova, U Sco, 35 days after its last nova outburst, and this similarity was also found by Ness et al. (2013). In U Sco, the SSS is only observed as a Thomson scattering corona, and the emission lines are attributed to the nova ejecta. It is interesting to note that in both CAL 87 and U Sco, the continuum has been attributed to a Thomson scattering corona, and U Sco is the only SSS-nova whose spectrum has clear similarities with the X-ray spectrum of CAL 87. Assuming that the compact object in CAL 87 is a WD, the inclination obtained by Meyer-Hofmeister et al. (1997), Oliveira & Steiner (2007), and Ribeiro et al. (2014) is in the 78 − 82° range. As does CAL 87, U Sco shows an X-ray eclipse, and has an inclination angle of 82.7° ±2.9° (Thoroughgood et al. 2001). The effective temperature (∼900 000 K) of U Sco is consistent with a WD mass of at least 1.3 M⊙, and the reprocessing factor for the WD radiation must have been on the order of 10% (Orio et al. 2013). Our spectral fitting indicates similar values for CAL 87, and also very similar absolute X-ray luminosities for both.
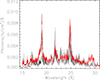 |
Fig. 6. Averaged XMM-Newton RGS spectrum of CAL 87 (black), multiplied by a factor of 7.7 to facilitate the comparison, and RGS spectrum of U Sco in exposure no. 0561580301 done 35 days after the optical maximum of the last outburst of this recurrent nova (red). |
The effective temperature (∼800 000 K) of CAL 87 is consistent with a WD mass of about 1.2 M⊙ (according to Wolf et al. 2013). We suggest that CAL 87 and U Sco are likely the same type of binary (high-mass hydrogen-burning WD viewed in a high-inclination binary), with different mass accretion rates. It is reasonable to suggest that the mass accretion rate is lower in U Sco and higher in CAL 87, which does not undergo nova outbursts, while U Sco is a recurrent nova. There is no correlation between the mass accretion rate and the orbital period for novae (Selvelli & Gilmozzi 2019); we therefore cannot obtain the relative accretion rates of these two system based on their relative orbital periods. Since CAL 87 may be an accreting WD without nova explosion, it is a type Ia progenitor candidate because the mass may increase one day to become close to the Chandrasekhar value.
5. Conclusions
We analyzed the puzzling high-resolution X-ray spectra of CAL 87 by using the archive X-ray data observed with the Chandra and XMM-Newton. Our analysis reached two main results that were previously concluded, and these two results are summarized as follows:
-
The emission lines originate from an extended region that was previously proposed by Ribeiro et al. (2014).
-
The continuum appears to be due to a Thomson scattered corona reflecting a small fraction of the X-ray flux of the WD, and Thomson scattering was previously proposed by Ebisawa et al. (2001) and Ness et al. (2013) to explain the X-ray spectra of CAL 87. Our analysis reached several new main results that extend what was done previously for CAL 87. The new main results resulting from our analysis can be summarized as follows:
-
There may be a new unidentified emission line at around 15.29 Å.
-
Two narrow absorption cores were found in the broadened emission lines in the spectra of August 2001, but not in the spectra of April 2003. This implies that there may be some transient material at rest wavelength that is outside of the emitting region of the emission lines.
-
The collisional ionization plasma in CAL 87 may not be in equilibrium.
-
We used physical models to fit the grating spectra of CAL 87, and we found that the best model includes a WD atmosphere with surface gravity ∼109 cm s−1, effective temperature ∼800 000 K, and mass ∼1.2 M⊙. Thus, CAL 87 contains a massive WD and, if it has a high mass accretion rate that prevents nova outbursts, it may be a type Ia supernova progenitor.
Acknowledgments
We express our deep gratitude to the anonymous referee for her or his constructive comments and suggestions, which helped us to improve the scientific content of this article. This research has made use of data obtained with the gratings on board Chandra and XMM-Newton. Songpeng Pei thanks Marina Orio, Ehud Behar, Uria Peretz and Jan-Uwe Ness for many useful conversations. This work was funded by the High-level Talents Research Start-up Fund Project of Liupanshui Normal University (LPSSYKYJJ202208), Science Research Project of University (Youth Project) of the Department of Education of Guizhou Province (QJJ[2022]348), the Science and Technology Foundation of Guizhou Province (QKHJC-ZK[2023]442), the Discipline-Team of Liupanshui Normal University (LPSSY2023XKTD11), and the Research Foundation of Qiannan Normal University for Nationalities (No. QNSY2019RC02).
References
- Akahori, T., & Yoshikawa, K. 2008, PASJ, 60, L19 [NASA ADS] [CrossRef] [Google Scholar]
- Arnaud, K. A. 1996, ASP Conf. Ser., 101, 17 [Google Scholar]
- Asai, K., Dotani, T., Nagase, F., et al. 1998, ApJ, 503, L143 [NASA ADS] [CrossRef] [Google Scholar]
- Bautista, M. A., & Kallman, T. R. 2000, ApJ, 544, 581 [Google Scholar]
- Bearda, H., Hartmann, W., Ebisawa, K., et al. 2002, A&A, 385, 511 [NASA ADS] [CrossRef] [EDP Sciences] [Google Scholar]
- Beardmore, A. P., Osborne, J. P., Page, K. L., et al. 2012, A&A, 545, A116 [NASA ADS] [CrossRef] [EDP Sciences] [Google Scholar]
- Behar, E., Cottam, J., & Kahn, S. M. 2001, ApJ, 548, 966 [NASA ADS] [CrossRef] [Google Scholar]
- Beiersdorfer, P., von Goeler, S., Bitter, M., & Thorn, D. B. 2001, Phys. Rev. A, 64, 032705 [NASA ADS] [CrossRef] [Google Scholar]
- Beiersdorfer, P., Bitter, M., von Goeler, S., & Hill, K. W. 2004, ApJ, 610, 616 [NASA ADS] [CrossRef] [Google Scholar]
- Bernitt, S., Brown, G. V., Rudolph, J. K., et al. 2012, Nature, 492, 225 [NASA ADS] [CrossRef] [Google Scholar]
- Bhatia, A. K., & Doschek, G. A. 1992, At. Data Nucl. Data Tab., 52, 1 [NASA ADS] [CrossRef] [Google Scholar]
- Borkowski, K. J., Lyerly, W. J., & Reynolds, S. P. 2001, ApJ, 548, 820 [Google Scholar]
- Brown, G. V., Beiersdorfer, P., Liedahl, D. A., Widmann, K., & Kahn, S. M. 1998, ApJ, 502, 1015 [Google Scholar]
- Brown, G. V., Beiersdorfer, P., Chen, H., Chen, M. H., & Reed, K. J. 2001, ApJ, 557, L75 [NASA ADS] [CrossRef] [Google Scholar]
- Brown, G. V., Beiersdorfer, P., Chen, H., et al. 2006, Phys. Rev. Lett., 96, 253201 [Google Scholar]
- Callanan, P. J., Machin, G., Naylor, T., & Charles, P. A. 1989, MNRAS, 241, 37P [NASA ADS] [CrossRef] [Google Scholar]
- Chen, G.-X. 2007, Phys. Rev. A, 76, 062708 [NASA ADS] [CrossRef] [Google Scholar]
- Cornille, M., Dubau, J., & Jacquemot, S. 1994, At. Data Nucl. Data Tab., 58, 1 [NASA ADS] [CrossRef] [Google Scholar]
- Cowley, A. P., Schmidtke, P. C., Crampton, D., & Hutchings, J. B. 1990, ApJ, 350, 288 [Google Scholar]
- Davis, J. E. 2008, AAS/High Energy Astrophysics Division, 10, 4.03 [NASA ADS] [Google Scholar]
- den Herder, J. W., Brinkman, A. C., Kahn, S. M., et al. 2001, A&A, 365, L7 [NASA ADS] [CrossRef] [EDP Sciences] [Google Scholar]
- de Plaa, J., Kaastra, J. S., Werner, N., et al. 2017, A&A, 607, A98 [NASA ADS] [CrossRef] [EDP Sciences] [Google Scholar]
- Dorman, B., Arnaud, K. A., & Gordon, C. A. 2003, AAS/High Energy Astrophysics Division, 7, 22.10 [NASA ADS] [Google Scholar]
- Ebisawa, K., Mukai, K., Kotani, T., et al. 2001, ApJ, 550, 1007 [NASA ADS] [CrossRef] [Google Scholar]
- Ebisawa, K., Rauch, T., & Takei, D. 2010, Astron. Nachr., 331, 152 [NASA ADS] [CrossRef] [Google Scholar]
- Eggleton, P. P. 1983, ApJ, 268, 368 [Google Scholar]
- Emma, P., Akre, R., Arthur, J., et al. 2010, Nat. Photon., 4, 641 [CrossRef] [Google Scholar]
- Foster, A. R., & Heuer, K. 2020, Atoms, 8, 49 [NASA ADS] [CrossRef] [Google Scholar]
- Foster, A. R., Ji, L., Smith, R. K., & Brickhouse, N. S. 2012, ApJ, 756, 128 [Google Scholar]
- Fruscione, A., McDowell, J. C., Allen, G. E., et al. 2006, SPIE Conf. Ser., 6270, 62701V [Google Scholar]
- Garmire, G. P., Bautz, M. W., Ford, P. G., Nousek, J. A., & Ricker, G. R. 2003, SPIE Conf. Ser., 4851, 28 [NASA ADS] [Google Scholar]
- Greiner, J. 1996, Lect. Notes Phys., 472, 91 [CrossRef] [Google Scholar]
- Greiner, J., Iyudin, A., Jimenez-Garate, M., et al. 2004, Rev. Mex. Astron. Astrofis. Conf. Ser., 20, 18 [NASA ADS] [Google Scholar]
- Gronenschild, E. H. B. M., & Mewe, R. 1982, A&AS, 48, 305 [NASA ADS] [Google Scholar]
- Gu, M. F. 2009, ArXiv e-prints [arXiv:0905.0519] [Google Scholar]
- HI4PI Collaboration (Ben Bekhti, N., et al.) 2016, A&A, 594, A116 [NASA ADS] [CrossRef] [EDP Sciences] [Google Scholar]
- Hutchings, J. B., Cowley, A. P., Schmidtke, P. C., & Crampton, D. 1995, AJ, 110, 2394 [NASA ADS] [CrossRef] [Google Scholar]
- Hutchings, J. B., Crampton, D., Cowley, A. P., & Schmidtke, P. C. 1998, ApJ, 502, 408 [NASA ADS] [CrossRef] [Google Scholar]
- Jansen, F., Lumb, D., Altieri, B., et al. 2001, A&A, 365, L1 [NASA ADS] [CrossRef] [EDP Sciences] [Google Scholar]
- Kahabka, P., & van den Heuvel, E. P. J. 2006, Compact Stellar X-ray Sources, 39, 461 [NASA ADS] [CrossRef] [Google Scholar]
- Kühn, S., Shah, C., López-Urrutia, J. R. C., et al. 2020, Phys. Rev. Lett., 124, 225001 [CrossRef] [Google Scholar]
- Long, K. S., Helfand, D. J., & Grabelsky, D. A. 1981, ApJ, 248, 925 [Google Scholar]
- Masai, K. 1994, ApJ, 437, 770 [NASA ADS] [CrossRef] [Google Scholar]
- Mason, K. O., Breeveld, A., Much, R., et al. 2001, A&A, 365, L36 [NASA ADS] [CrossRef] [EDP Sciences] [Google Scholar]
- Mauche, C. W., Liedahl, D. A., & Fournier, K. B. 2001, ApJ, 560, 992 [NASA ADS] [CrossRef] [Google Scholar]
- Mendoza, C., & Bautista, M. A. 2017, Phys. Rev. Lett., 118, 163002 [NASA ADS] [CrossRef] [Google Scholar]
- Mewe, R., Raassen, A. J. J., Drake, J. J., et al. 2001, A&A, 368, 888 [NASA ADS] [CrossRef] [EDP Sciences] [Google Scholar]
- Meyer-Hofmeister, E., Schandl, S., & Meyer, F. 1997, A&A, 321, 245 [NASA ADS] [Google Scholar]
- Micke, P., Kühn, S., Buchauer, L., et al. 2018, Rev. Sci. Instrum., 89, 063109 [NASA ADS] [CrossRef] [Google Scholar]
- Mohan, M., Sharma, R., & Eissner, W. 1997, ApJS, 108, 389 [NASA ADS] [CrossRef] [Google Scholar]
- Nelson, T., Orio, M., Cassinelli, J. P., et al. 2008, ApJ, 673, 1067 [NASA ADS] [CrossRef] [Google Scholar]
- Ness, J. U., Schaefer, B. E., Dobrotka, A., et al. 2012, ApJ, 745, 43 [NASA ADS] [CrossRef] [Google Scholar]
- Ness, J. U., Osborne, J. P., Henze, M., et al. 2013, A&A, 559, A50 [NASA ADS] [CrossRef] [EDP Sciences] [Google Scholar]
- Oliveira, A. S., & Steiner, J. E. 2007, A&A, 472, L21 [NASA ADS] [CrossRef] [EDP Sciences] [Google Scholar]
- Oreshkina, N. S., Cavaletto, S. M., Keitel, C. H., & Harman, Z. 2014, Phys. Rev. Lett., 113, 143001 [Google Scholar]
- Orio, M., Ebisawa, K., Heise, J., & Hartmann, J. 2004, Rev. Mex. Astron. Astrofis. Conf. Ser., 20, 210 [NASA ADS] [Google Scholar]
- Orio, M., Behar, E., Gallagher, J., et al. 2013, MNRAS, 429, 1342 [NASA ADS] [CrossRef] [Google Scholar]
- Page, K. L., Osborne, J. P., Wagner, R. M., et al. 2013, ApJ, 768, L26 [NASA ADS] [CrossRef] [Google Scholar]
- Phillips, K. J. H., Bhatia, A. K., Mason, H. E., & Zarro, D. M. 1996, ApJ, 466, 549 [NASA ADS] [CrossRef] [Google Scholar]
- Phillips, K. J. H., Greer, C. J., Bhatia, A. K., et al. 1997, A&A, 324, 381 [NASA ADS] [Google Scholar]
- Pietrzyński, G., Graczyk, D., Gieren, W., et al. 2013, Nature, 495, 76 [Google Scholar]
- Porquet, D., & Dubau, J. 2000, A&AS, 143, 495 [NASA ADS] [CrossRef] [EDP Sciences] [Google Scholar]
- Porquet, D., Mewe, R., Dubau, J., Raassen, A. J. J., & Kaastra, J. S. 2001, A&A, 376, 1113 [NASA ADS] [CrossRef] [EDP Sciences] [Google Scholar]
- Prokhorov, D. A. 2010, A&A, 509, A29 [NASA ADS] [CrossRef] [EDP Sciences] [Google Scholar]
- Rauch, T., Deetjen, J. L., Dreizler, S., & Werner, K. 2000, ASP Conf. Ser., 199, 337 [NASA ADS] [Google Scholar]
- Ribeiro, T., Lopes de Oliveira, R., & Borges, B. W. 2014, ApJ, 792, 20 [NASA ADS] [CrossRef] [Google Scholar]
- Saba, J. L. R., Schmelz, J. T., Bhatia, A. K., & Strong, K. T. 1999, ApJ, 510, 1064 [NASA ADS] [CrossRef] [Google Scholar]
- Safronova, U. I., Namba, C., Murakami, I., Johnson, W. R., & Safronova, M. S. 2001, Phys. Rev. A, 64, 012507 [NASA ADS] [CrossRef] [Google Scholar]
- Santana, J. A., Lepson, J. K., Träbert, E., & Beiersdorfer, P. 2015, Phys. Rev. A, 91, 012502 [NASA ADS] [CrossRef] [Google Scholar]
- Schandl, S., Meyer-Hofmeister, E., & Meyer, F. 1997, A&A, 318, 73 [NASA ADS] [Google Scholar]
- Schmidtke, P. C., McGrath, T. K., Cowley, A. P., & Frattare, L. M. 1993, PASP, 105, 863 [CrossRef] [Google Scholar]
- Selvelli, P., & Gilmozzi, R. 2019, A&A, 622, A186 [NASA ADS] [CrossRef] [EDP Sciences] [Google Scholar]
- Smith, B. W., Mann, J. B., Cowan, R. D., & Raymond, J. C. 1985, ApJ, 298, 898 [NASA ADS] [CrossRef] [Google Scholar]
- Smith, R. K., Brickhouse, N. S., Liedahl, D. A., & Raymond, J. C. 2001, ApJ, 556, L91 [Google Scholar]
- Starrfield, S., Timmes, F. X., Iliadis, C., et al. 2012, Balt. Astron., 21, 76 [NASA ADS] [Google Scholar]
- Strüder, L., Briel, U., Dennerl, K., et al. 2001, A&A, 365, L18 [Google Scholar]
- Tanaka, Y., Inoue, H., & Holt, S. S. 1994, PASJ, 46, L37 [NASA ADS] [Google Scholar]
- Thoroughgood, T. D., Dhillon, V. S., Littlefair, S. P., Marsh, T. R., & Smith, D. A. 2001, MNRAS, 327, 1323 [NASA ADS] [CrossRef] [Google Scholar]
- Tsujimoto, M., Mizumoto, M., Ebisawa, K., Odaka, H., & Wada, Q. 2024, ApJ, 960, 46 [NASA ADS] [CrossRef] [Google Scholar]
- Turner, M. J. L., Abbey, A., Arnaud, M., et al. 2001, A&A, 365, L27 [CrossRef] [EDP Sciences] [Google Scholar]
- van den Heuvel, E. P. J., Bhattacharya, D., Nomoto, K., & Rappaport, S. A. 1992, A&A, 262, 97 [Google Scholar]
- Werner, N., Böhringer, H., Kaastra, J. S., et al. 2006, A&A, 459, 353 [NASA ADS] [CrossRef] [EDP Sciences] [Google Scholar]
- Wolf, W. M., Bildsten, L., Brooks, J., & Paxton, B. 2013, ApJ, 777, 136 [Google Scholar]
- Wu, C., & Gao, X. 2019, Sci. Rep., 9, 7463 [NASA ADS] [CrossRef] [Google Scholar]
- Xu, H., Kahn, S. M., Peterson, J. R., et al. 2002, ApJ, 579, 600 [NASA ADS] [CrossRef] [Google Scholar]
All Tables
Ratio of the relative intensity of Fe XVII emission lines at 15.014 and 15.261 Å (I(15.01 Å)/I(15.26 Å), also labeled as I3C/I3D).
All Figures
|
Fig. 1. Light curve of XMM-Newton EPIC-pn observation of CAL 87 at 0.2−10 keV, binned with 200 s per bin. The blue lines show the time intervals in which we extracted the out-of-eclipse spectra, and the blue lines show the time intervals in which we extracted the in-eclipse spectra. For the comparison we neglected the spectrum observed in a 2100 s interval at the beginning and end of the eclipses. |
| In the text | |
|
Fig. 2. Chandra LETG spectrum (left) and averaged XMM-Newton RGS spectrum (right) of CAL 87, fitted with an atmosphere model and a collisional ionization plasma model. The characteristics and parameters are given in Table 2. The fit is shown as the red solid line. |
| In the text | |
|
Fig. 3. Chandra LETG spectrum (left) and averaged XMM-Newton RGS spectrum (right) of CAL 87, fitted by using an atmosphere model and a nonequilibrium ionization collisional plasma model. The characteristics and parameters are given in Table 2. The fit is shown as the red solid line. |
| In the text | |
|
Fig. 4. O VII He-like triplet, unbinned, as measured in the averages RGS1 and RGS2 spectra of CAL 87, (black data points), and a fit with Gaussians for the lines, and a power law for the continuum (red solid line). |
| In the text | |
|
Fig. 5. O VIII Lyα region in Chandra spectra (left) and XMM-Newton spectra (right) of CAL 87, and a fit, shown as the red solid line, using a Gaussian for the line and a power law for the continuum. The residuals are shown in the panel below each plot. The residuals show how the line profile in Chandra spectra can be interpreted as having an embedded absorption core at the center of the line, rather than as double-peaked profiles. |
| In the text | |
|
Fig. 6. Averaged XMM-Newton RGS spectrum of CAL 87 (black), multiplied by a factor of 7.7 to facilitate the comparison, and RGS spectrum of U Sco in exposure no. 0561580301 done 35 days after the optical maximum of the last outburst of this recurrent nova (red). |
| In the text | |
Current usage metrics show cumulative count of Article Views (full-text article views including HTML views, PDF and ePub downloads, according to the available data) and Abstracts Views on Vision4Press platform.
Data correspond to usage on the plateform after 2015. The current usage metrics is available 48-96 hours after online publication and is updated daily on week days.
Initial download of the metrics may take a while.