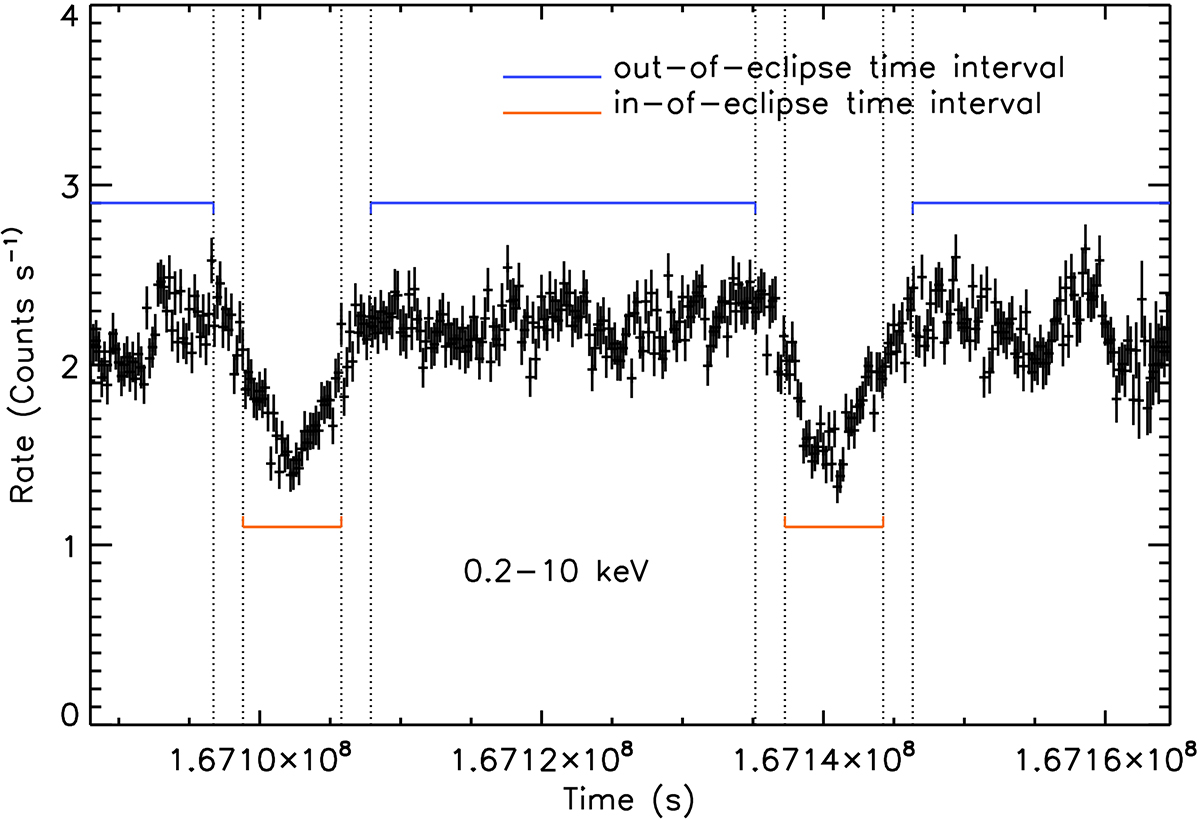
Fig. 1.
Download original image
Light curve of XMM-Newton EPIC-pn observation of CAL 87 at 0.2−10 keV, binned with 200 s per bin. The blue lines show the time intervals in which we extracted the out-of-eclipse spectra, and the blue lines show the time intervals in which we extracted the in-eclipse spectra. For the comparison we neglected the spectrum observed in a 2100 s interval at the beginning and end of the eclipses.
Current usage metrics show cumulative count of Article Views (full-text article views including HTML views, PDF and ePub downloads, according to the available data) and Abstracts Views on Vision4Press platform.
Data correspond to usage on the plateform after 2015. The current usage metrics is available 48-96 hours after online publication and is updated daily on week days.
Initial download of the metrics may take a while.