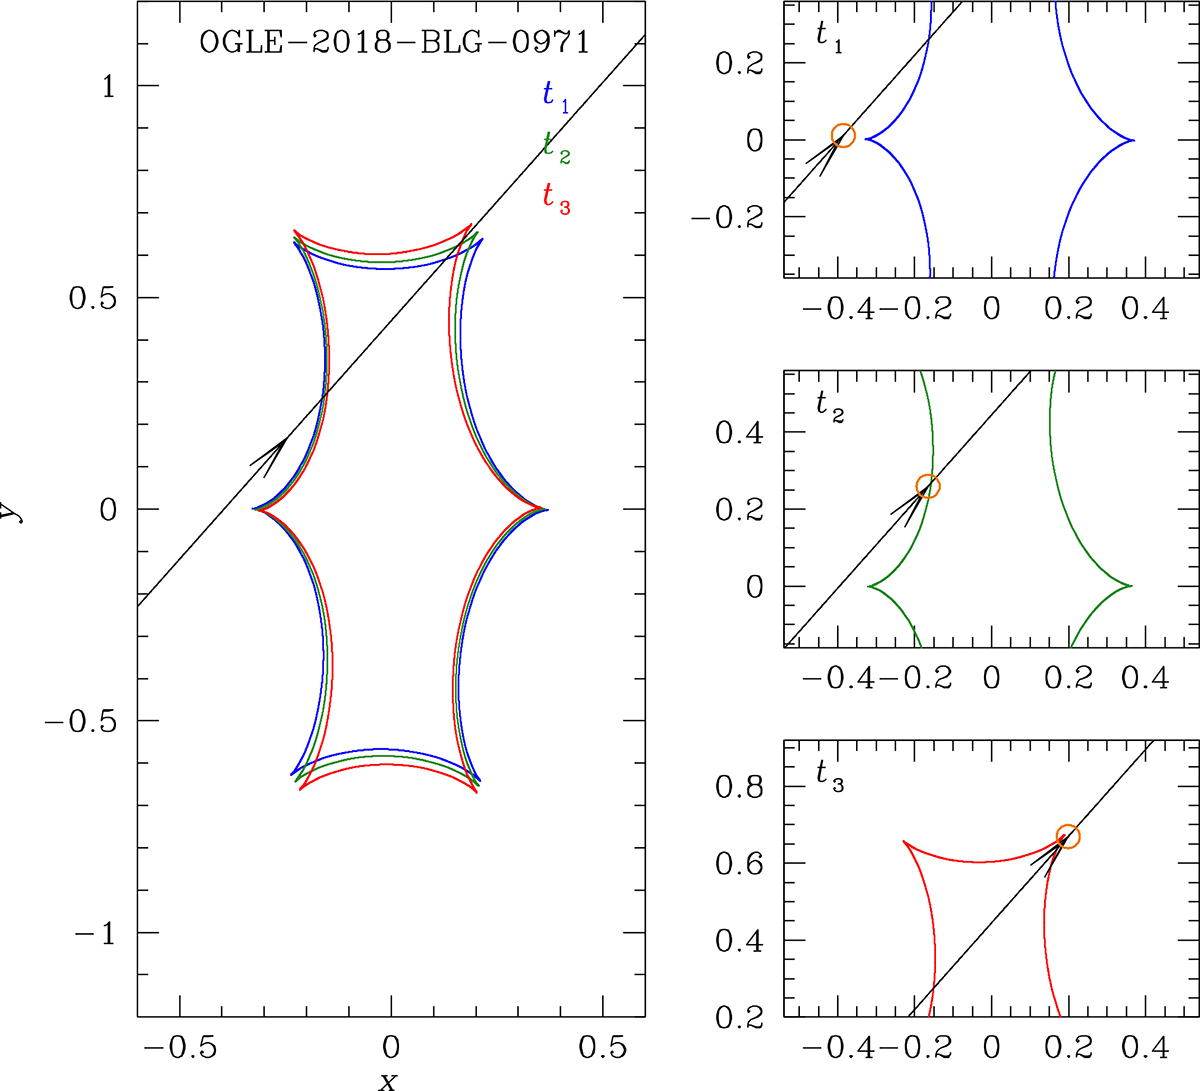
Fig. 4.
Download original image
Lens system configuration for OGLE-2018-BLG-0971. The diagonal line with the arrow represents the source trajectory, and the closed figures composed of concave curves represent caustics. The caustic shape and location evolve over time due to the orbital motion of the lens. The sets of caustics drawn in black, green, and red correspond to the three anomaly epochs t1, t2, and t3 marked in Fig. 1. The right panels display still frames capturing the approach of the source to the caustic at these three epochs. The size of the orange circle on the source trajectory that appears in each right panel indicates the angular dimension of the source relative to the size of the caustic.
Current usage metrics show cumulative count of Article Views (full-text article views including HTML views, PDF and ePub downloads, according to the available data) and Abstracts Views on Vision4Press platform.
Data correspond to usage on the plateform after 2015. The current usage metrics is available 48-96 hours after online publication and is updated daily on week days.
Initial download of the metrics may take a while.