Open Access
Fig. 1.
Download original image
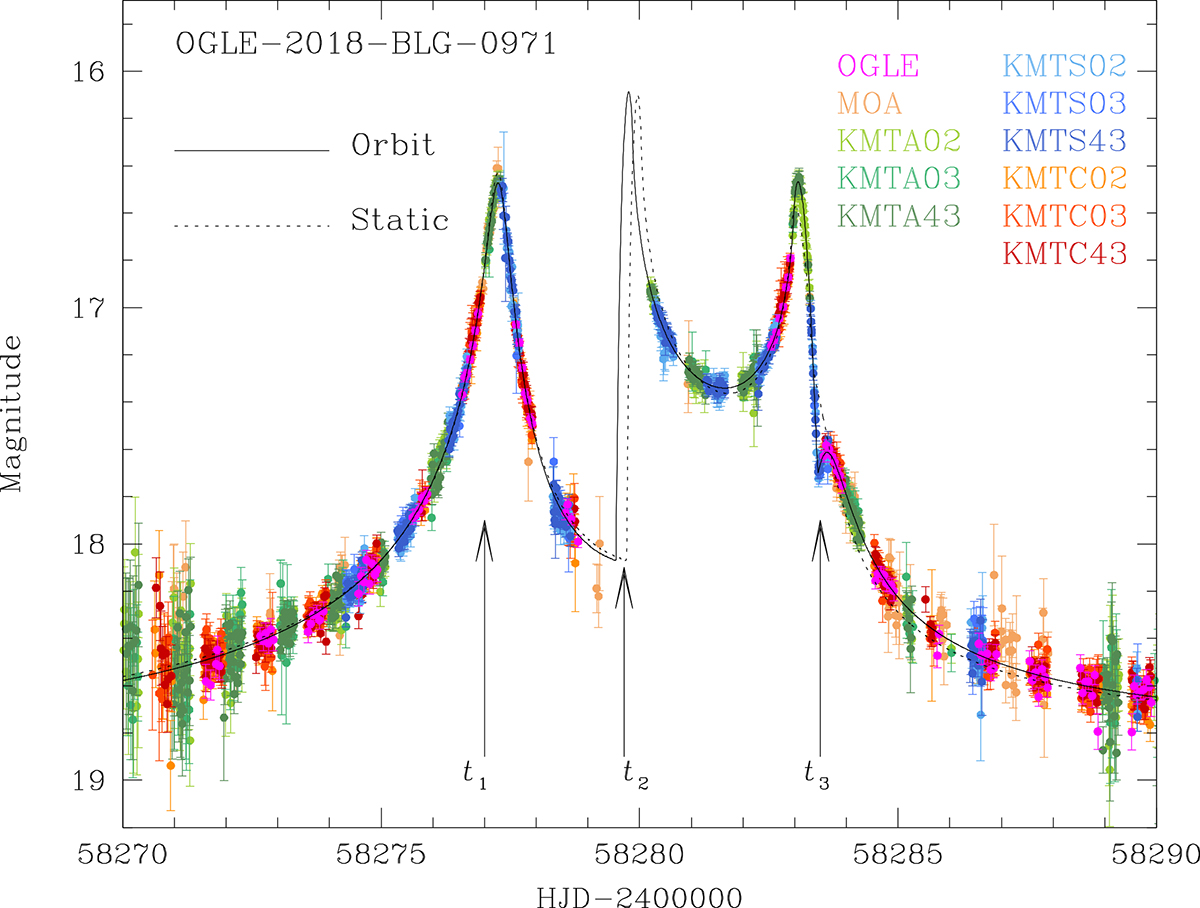
Light curve of the lensing event OGLE-2018-BLG-0971. The solid and dotted curves drawn over the data points represent the model curves obtained from the 2L1S analyses with and without the orbital motion of the lens, respectively. The arrows labeled t1, t2, and t3 denote the times of the major anomaly features.
Current usage metrics show cumulative count of Article Views (full-text article views including HTML views, PDF and ePub downloads, according to the available data) and Abstracts Views on Vision4Press platform.
Data correspond to usage on the plateform after 2015. The current usage metrics is available 48-96 hours after online publication and is updated daily on week days.
Initial download of the metrics may take a while.