Fig. 9.
Download original image
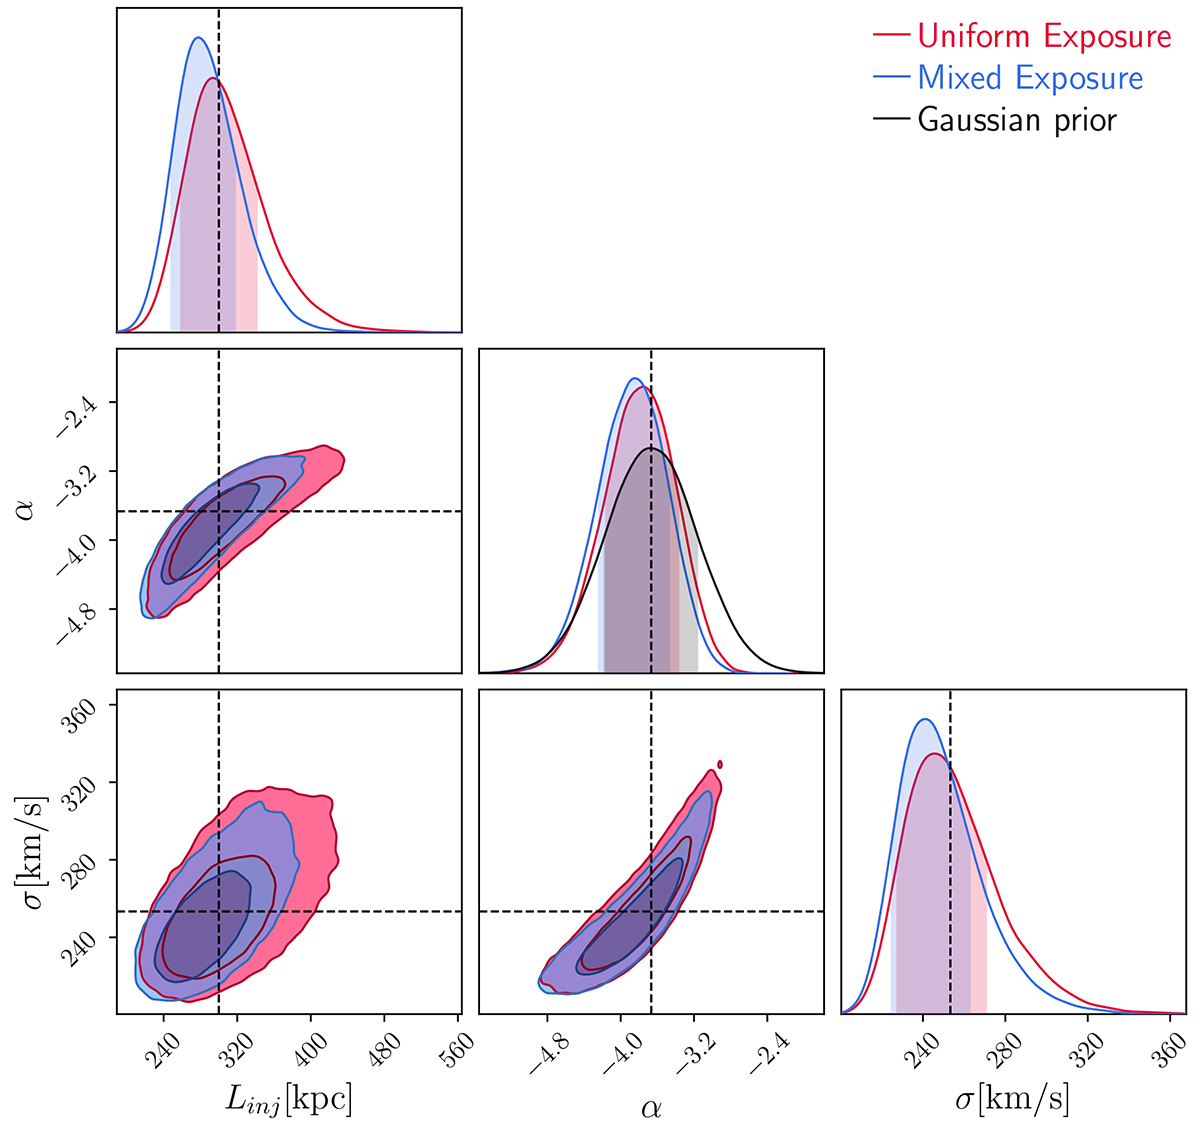
Posterior distribution obtained with setting the dissipation scale to the input value and letting the injection scale, norm and slope free. A Gaussian prior was set on the slope with π(α)∼𝒩(−11/3, 0.5), whereas the other parameters had uniform priors. The blue contour show the posterior distribution for the Mix exposure observation and the red for the uniform exposure. The prior is plotted in black. Dotted lines show the input values of the simulations.
Current usage metrics show cumulative count of Article Views (full-text article views including HTML views, PDF and ePub downloads, according to the available data) and Abstracts Views on Vision4Press platform.
Data correspond to usage on the plateform after 2015. The current usage metrics is available 48-96 hours after online publication and is updated daily on week days.
Initial download of the metrics may take a while.