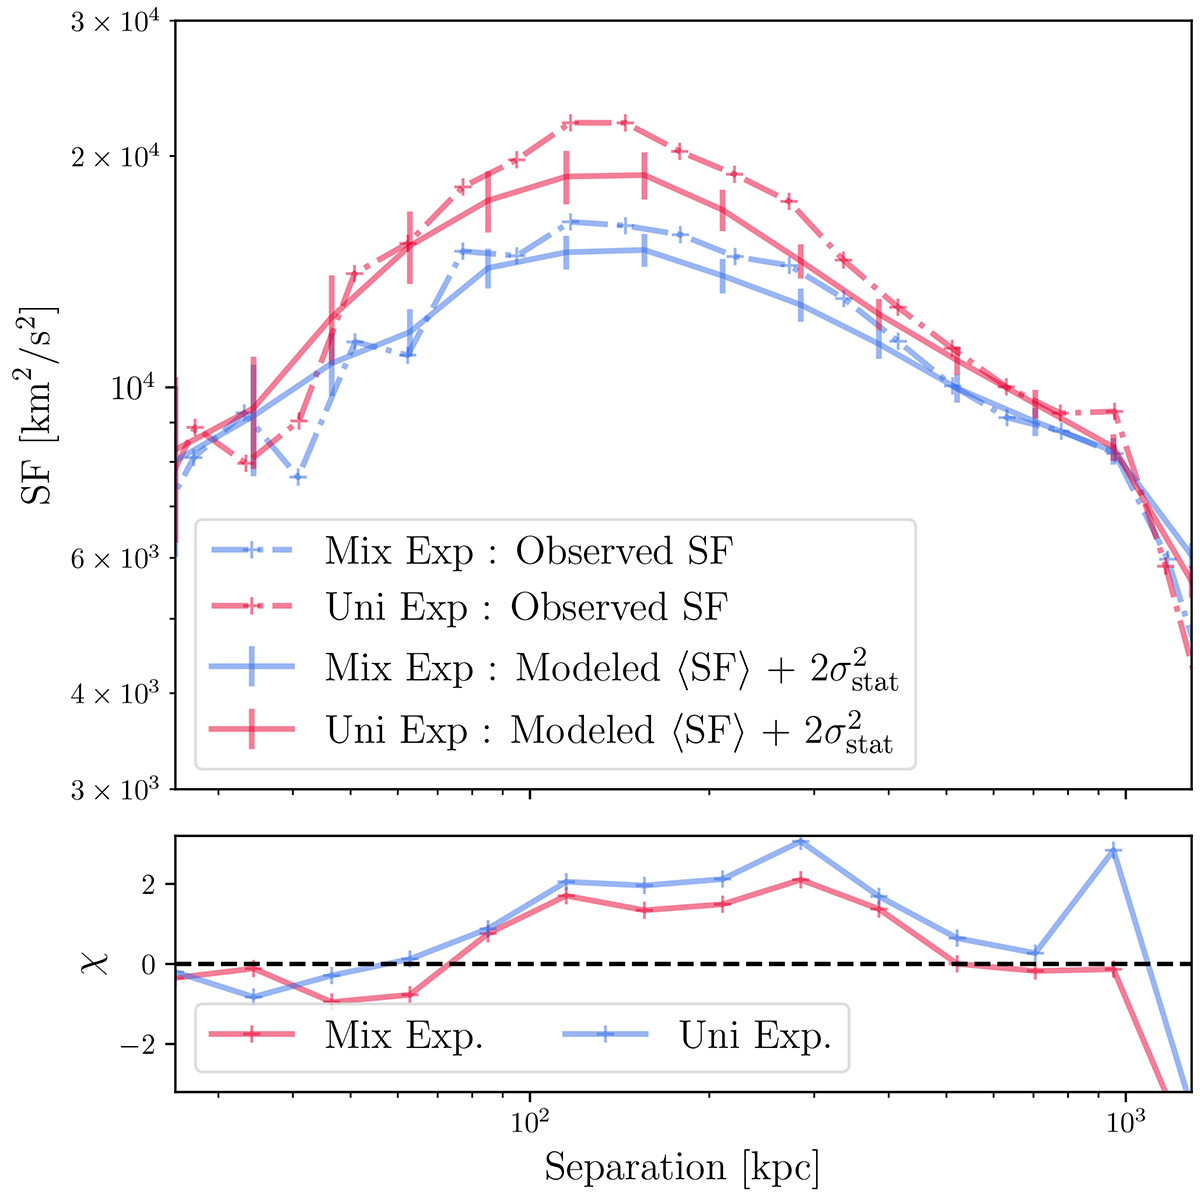
Fig. 4.
Download original image
Structure functions and residuals for our simulation of 19 X-IFU pointings. The blue curves show the results for the “uniform exposure” configuration and the red curves refer to those of the “mix exposure” configuration. The upper plot shows the structure functions, observed in the mock observations in dash-dotted lines, and the modeled in plain lines. The total error is over-plotted on the modeled structure function with error bars, as its computation is part of the modeling, as described in Sect. 4.2. The lower panel shows the value of χ = (data-model) and the errors.
Current usage metrics show cumulative count of Article Views (full-text article views including HTML views, PDF and ePub downloads, according to the available data) and Abstracts Views on Vision4Press platform.
Data correspond to usage on the plateform after 2015. The current usage metrics is available 48-96 hours after online publication and is updated daily on week days.
Initial download of the metrics may take a while.