Open Access
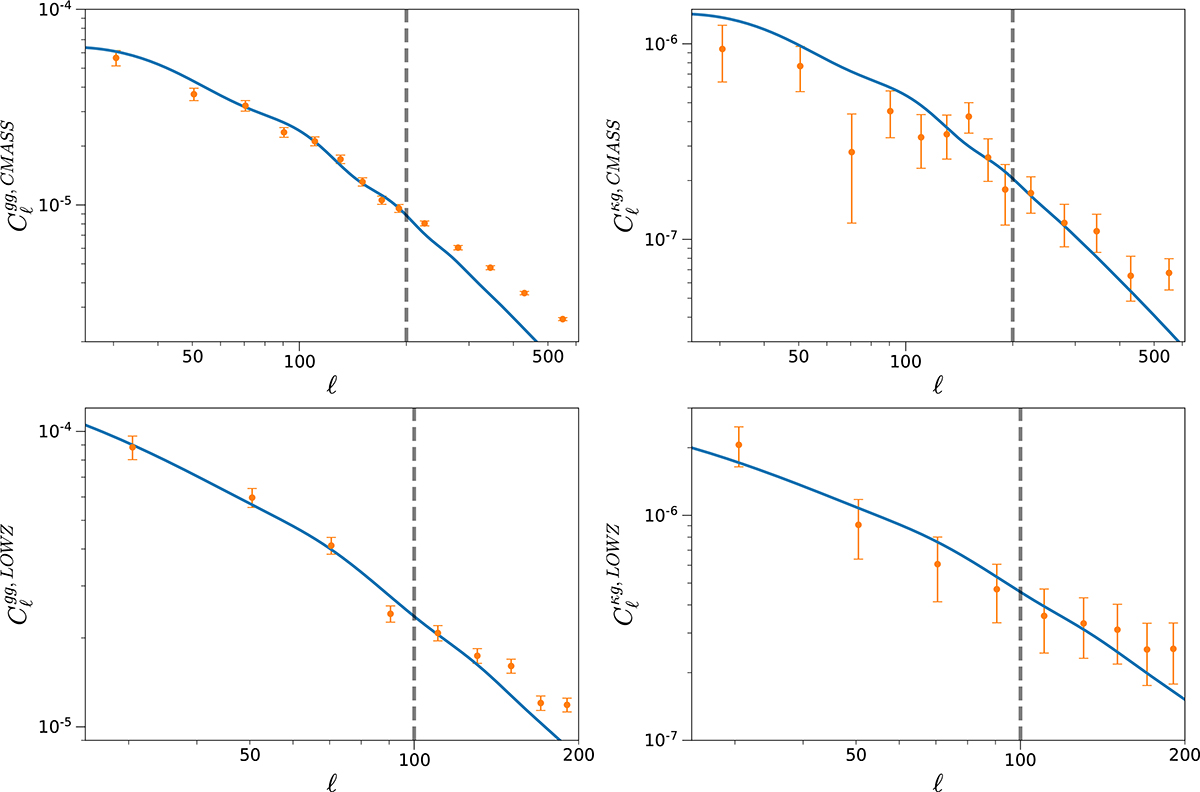
Fig. 7.
Download original image
Measured angular power spectra (orange) and best fit (blue) obtained using MGCLASS, as a function of multipole. The gray dashed line represents the limit between the linear and nonlinear regimes. We only used multipoles below this limit in this analysis. We note the different multipole ranges for CMASS and LOWZ.
Current usage metrics show cumulative count of Article Views (full-text article views including HTML views, PDF and ePub downloads, according to the available data) and Abstracts Views on Vision4Press platform.
Data correspond to usage on the plateform after 2015. The current usage metrics is available 48-96 hours after online publication and is updated daily on week days.
Initial download of the metrics may take a while.