Fig. 2.
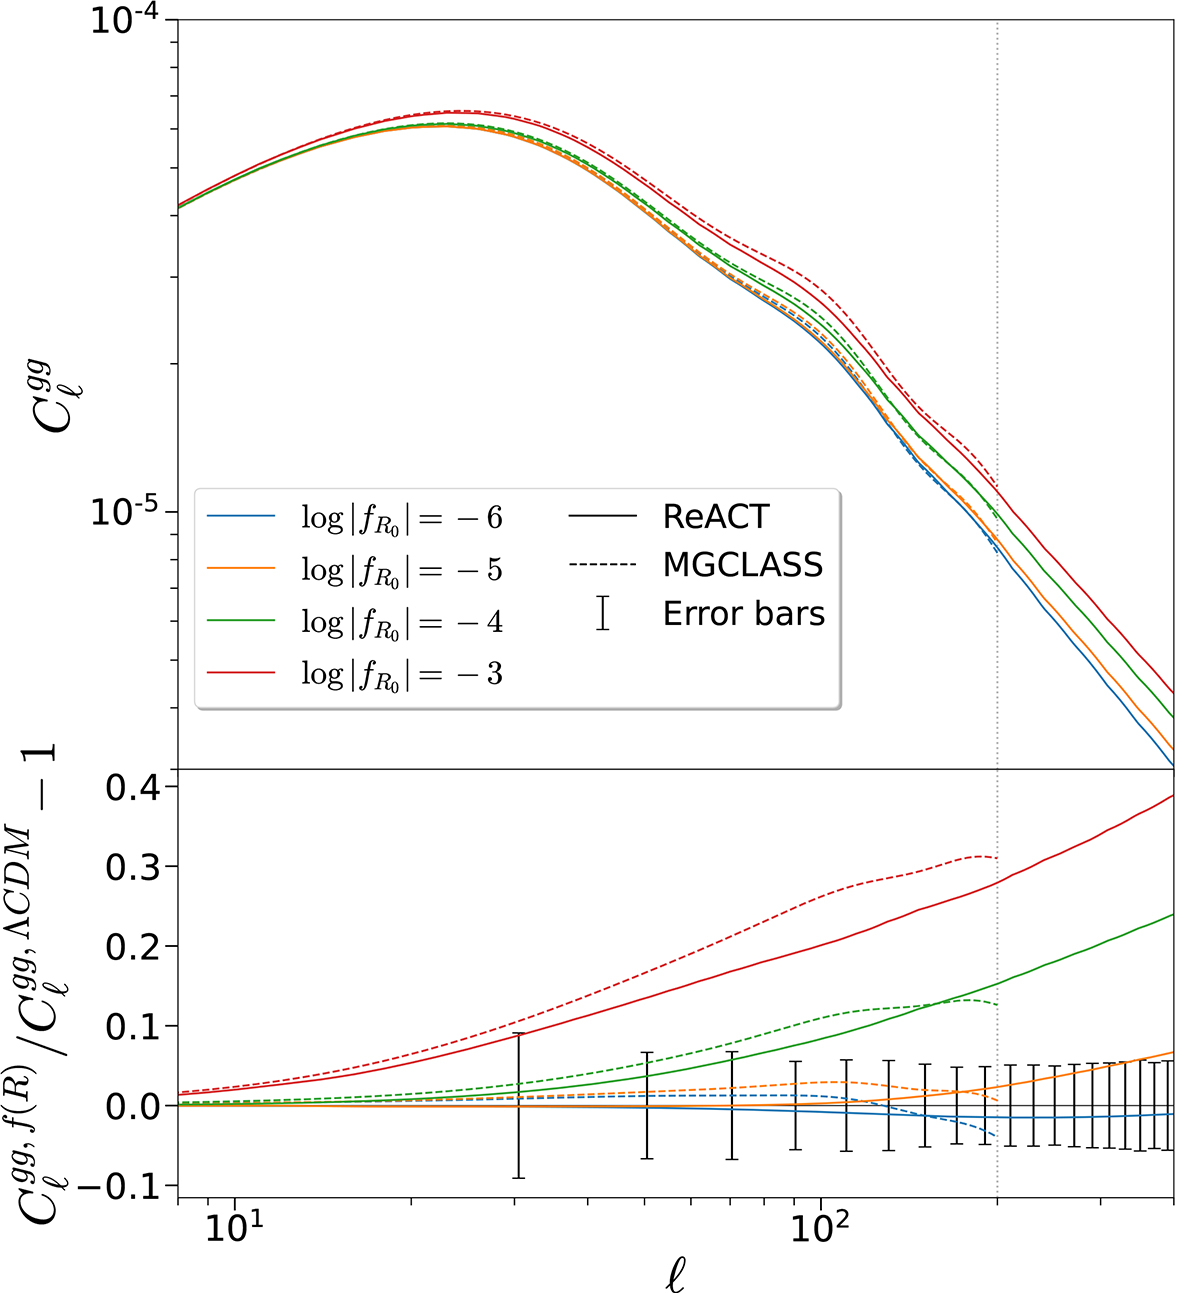
Download original image
Effect of changing the value of log|fR0| on the auto-power spectrum of CMASS, with all other parameters fixed. The bottom panel shows the difference relative to the nonlinear power spectrum in ΛCDM, together with the 1σ uncertainties of CMASS. Plain lines are obtained using ReACT and the dashed lines with MGCLASS. The gray dotted line shows the limit between the linear and nonlinear regimes. We limit our analysis to the linear regime, but show the theoretical predictions with ReACT. We do not show the predictions with MGCLASS, which fail in this regime.
Current usage metrics show cumulative count of Article Views (full-text article views including HTML views, PDF and ePub downloads, according to the available data) and Abstracts Views on Vision4Press platform.
Data correspond to usage on the plateform after 2015. The current usage metrics is available 48-96 hours after online publication and is updated daily on week days.
Initial download of the metrics may take a while.