| Issue |
A&A
Volume 686, June 2024
|
|
|---|---|---|
| Article Number | A214 | |
| Number of page(s) | 14 | |
| Section | Numerical methods and codes | |
| DOI | https://doi.org/10.1051/0004-6361/202348454 | |
| Published online | 14 June 2024 | |
Dynamic estimation method for pulsar periods based on photon energy distribution folding and image template matching
1
Institute of Large-scale Scientific Facility and Centre for Zero Magnetic Field Science, Beihang University,
Beijing,
100191,
PR
China
e-mail: This email address is being protected from spambots. You need JavaScript enabled to view it.
2
School of Instrumentation Science and Opto-electronics Engineering, Beihang University,
Beijing,
100191,
PR
China
3
National Institute of Extremely-Weak Magnetic Field Infrastructure,
Hangzhou,
310051,
PR
China
4
Hefei National Laboratory,
Hefei,
230088,
PR
China
Received:
1
November
2023
Accepted:
4
March
2024
Abstract
Aims. The accuracy of the pulsar period estimation directly affects the restoration effect of the signal profile. A more accurate pulsar profile will help improve the accuracy of pulsar delay estimation and thereby improve the performance of X-ray pulsar navigation. This paper proposes a pulsar period estimation method based on photon energy distribution folding and image template matching (PETM).
Methods. This method uses the probability distribution information of photon energy for weighted epoch folding. The one-dimensional (1D) profile information was converted into two-dimensional (2D) image information through reverse space-filling curve (SFC) encoding. Then, a feature matching was performed between the target structure and the template structure. At the same time, the criterion of Pearson correlation coefficient (PCC) was used to quantitatively evaluate the matching effect to estimate the optimal period.
Results. The simulation results show that the period estimation accuracy of the PETM method is significantly improved, as compared with the traditional χ2-test method. This work also analyzes the folding effect based on the photon energy distribution model and conducts simulation experiments and comparisons on influencing factors, such as noise interference and data quality. At the same time, we also specifically demonstrated the effectiveness of the PETM method for the glitch phenomenon (i.e., a sudden change in period) of pulsar periods. Finally, we also used China’s XPNAV-1 satellite to conduct experiments and analysis of the actual observation data of PSR B0531+21 pulsar within a fixed period of time. The results show that the period estimation accuracy of this method is 4.8190 ns, which is 50.23% higher than the traditional χ2-test method. The method proposed in this article has the advantages of high estimation accuracy, stable estimation performance, strong anti-interference ability, and excellent dynamic period estimation performance. Therefore, it can further improve the navigation performance of X-ray pulsars.
Key words: methods: data analysis
© The Authors 2024
 Open Access article, published by EDP Sciences, under the terms of the Creative Commons Attribution License (https://creativecommons.org/licenses/by/4.0), which permits unrestricted use, distribution, and reproduction in any medium, provided the original work is properly cited.
This article is published in open access under the Subscribe to Open model. This email address is being protected from spambots. You need JavaScript enabled to view it. to support open access publication.
1 Introduction
In recent years, deep space exploration technology has continued to develop and the requirements for autonomous spacecraft navigation technology have become increasingly urgent (Cui et al. 2016; Zhang et al. 2018). Celestial navigation is an autonomous navigation method with a high level of accuracy and reliability, playing an important role in the fields of deep space exploration and autonomous navigation (Chen et al. 2017). However, since traditional celestial navigation methods are limited by factors such as limited observational objects and unstable observation conditions, their navigation accuracy cannot always be guaranteed (Fang et al. 2021). As an emerging celestial navigation method, X-ray pulsar navigation can provide a stable space-time reference and ultra-high positioning accuracy for spacecraft. Thus, it carries important engineering applications (Janssen et al. 2010; Xiong et al. 2009).
The principle of X-ray pulsar navigation is to calculate the time delay between the time when the pulsar signal reaches the Solar System barycenter (SSB) and the time when it reaches the spacecraft at the same time. This result is converted into the distance between the SSB and the spacecraft in the direction of the pulsar, thereby determining the position of the spacecraft (Liu et al. 2010). In the process of X-ray pulsar navigation, it is often necessary to use the pulse time of arrival (TOA) as a quantity measurement for navigation filtering (Liu et al. 2023). However, because the pulsar signal is very weak, the spacecraft cannot receive continuous pulse signals; instead, it only receive a series of photon time of arrival (PTOA) sequences and cannot directly calculate TOA information (Ning et al. 2017). Therefore, one of the key technologies for X-ray pulsar navigation is how to obtain high-precision TOA information.
There are two common key methods for obtaining TOA information. The first method is to use PTOA information directly. The probability density function of the PTOA sequence is used to perform a maximum likelihood estimation of the pulse time delay (Xue et al. 2015; Wang et al. 2022). The phase offset is obtained directly by maximizing the similarity function. However, this method requires iterative optimization using numerical solutions, which necessitates a large amount of calculations. It is tempting to fall into the local optimal solution, however, it is not suitable for deep space exploration missions that require real-time navigation solution at present. The second method is to use the photon number information in the PTOA data to perform epoch folding and fold the pulse profile based on the pulsar period. By performing a cross-correlation operation on the pulse profile received at the spacecraft and the standard pulse profile at the SSB, the phase offset is directly calculated (Emadzadeh & Speyer 2011). This method is more intuitive and requires fewer calculations, but the key lies in how to accurately estimate the dynamic period of the pulsar.
For the estimation of pulsar period, Leahy et al. (1983) proposed a traditional pulsar period estimation method: the χ2 epoch-folding algorithm. This method uses PTOA data to perform profile folding one by one within the period search range and it uses the χ2-test function to evaluate the folding effect and select the optimal period. This method has simpler calculations and better universality, but it is greatly affected by noise and has higher performance requirements for X-ray detectors. Subsequently, Buccheri et al. (1983) and Jager et al. (1989) successively proposed using Z2-test function and H-test function to evaluate the folding effect. At the same time, Bachetti et al. (2021) expanded the Z2-test function and H-test function to improve the period search sensitivity of low-significance pulsars. In order to optimize the “epoch” process, Liu et al. (2019) proposed a fast period estimation method based on the compressed sensing matrix. This method uses the changing pattern of the pulsar period during the folding process to achieve fast period estimations. Although the calculation amount of this method is greatly reduced, the estimation accuracy needs to be further improved. In order to solve the problem that the number of bins limits the estimation accuracy, Li et al. (2023) proposed a pulsar period estimation method based on variable encapsulation segments of equiphoton distribution. This method further improves the accuracy of period estimation by selecting the optimal number of bins, but the amount of calculation also increases. At the same time, Cassanelli et al. (2022) converted the one-dimensional (1D) “phase” information of the profile into two-dimensional (2D) “phase-data segment number” information by dividing the observation data into several segments. The period is estimated by testing the consistency of peak values in different observation data segments. This method introduces the problem of pulsar period estimations from traditional 1D signal processing to the field of 2D information computing for the first time. The above methods all use photon number information to perform epoch folding, but the energy distribution information of photons also has a certain impact on the folding effect of the profile. Using only the photon number information for profile folding may underestimate the impact of interference factors. Therefore, it is necessary to introduce photon energy distribution information when performing epoch folding.
This paper proposes a pulsar period dynamic estimation method based on photon energy distribution folding and image template matching (PETM). First, unlike the above estimation methods, this work combines the probability distribution information of photon energy to perform profile-weighted folding. Secondly, the folded 1D pulsar profile signal is converted into a 2D image signal through the reverse space-filling curve (SFC). Finally, we use the template matching method to compare the features in the 2D image signal with the standard features. We use the Pearson correlation coefficient (PCC) to quantitatively evaluate the matching degree. This method estimates the optimal period by finding the most similar features to determine the best folding profile. Compared with the traditional method, the method proposed in this article can further improve the accuracy of period estimation, based on the premise that the performance of existing X-ray detectors meets the requirements.
This paper is organized is as follows. Section 2 establishes the pulsar profile model based on photon energy distribution folding and the profile phase correction model. Section 3 describes how to apply reverse SFC to convert the 1D pulsar profile signal into a 2D image signal. Section 4 introduces the principle of template matching and the selection of quantitative evaluation indicators. Section 5 presents the experiments and analyses of the simulation data and the measured data.
2 Pulsar profile and phase shift model
In this section, a pulsar profile model is established based on the probability distribution information of photon energy to facilitate subsequent direct estimation of TOA information. Second, in view of the dynamic change characteristics of the standard period, a profile phase movement model is established to unify the contour phase and improve the efficiency of subsequent image matching.
2.1 Pulsar profile model based on photon energy distribution folding
Traditional epoch folding uses the PTOA information converted to the SSB as the time standard. It uses the pulsar photon number information received by the detector to perform an epoch folding to obtain the pulsar profile. This method is essentially an epoch-folding operation with the same weight on the received pulsar information.
However, in actual missions, due to problems such as the large amount of interference in the universe and limited detector performance, using only the number of photons to fold the pulsar profile will often cause the folding effect to be greatly affected. This is because when the profile curve is accumulated, regardless of whether the arriving photons are valid information or noise interference, they are accumulated and included in the pulsar profile curve with equal weight. If the noise is too large, the true profile of the pulsar will be “obliterated” in the noise, making it impossible to accurately estimate the pulsar period. However, during the detection of pulsar signals, the detector is not only equipped to identify the PTOA, but it can also detect the energy carried by the arriving photons. Weighting the photons in the folding process based on the statistical distribution characteristics of the X-ray pulsar energy occurrence frequency can greatly suppress the impact of interference factors, such as the effect of noise on the profile folding. This is because when a suspected interfering noise photon arrives, a smaller weight will be selected based on its energy probability distribution curve to accumulate the photon into the profile curve, thereby reducing the impact of noise photons and improving the pulse profile restoration effect.
Therefore, in order to restore the pulsar profile more realistically and improve the accuracy of TOA estimation, this study uses the distribution characteristics of pulsar photon energy to perform weighted epoch folding; namely, based on the different occurrence probabilities of the energy carried by photons, different weight information is used for profile folding.
Common fitting methods for pulsar energy distribution include log-normal fit, power-law fit, power-law and logarithmic fit, power-law and exponential fit, and so on (Mickaliger et al. 2018; Yan et al. 2022; Abdo et al. 2010). Combined with the detection data of the focused X-ray detector on the XPNAV-1 satellite, this work uses the power-law and exponential fit, which offers the suitable fitting effect for the detector to perform a curve fitting on the probability distribution of pulsar energy. The power-law and exponential fit has the form of a scaled probability density function (PDF) distribution, expressed as:
![Mathematical equation: $\[P_{\text {pow/exp }}(E)=\frac{a E^b}{e^{c E}},\]$](/articles/aa/full_html/2024/06/aa48454-23/aa48454-23-eq1.png) (1)
(1)
where E is the energy carried by the arriving photon, and a, b, and c are the fitting parameters, respectively. Then, Ppow/exp(E) represents the probability of a photon of an energy, E, appearing. Figure 1 shows the distribution characteristic curve of pulsar photon energy obtained by using power-law and exponential fit.
Supposing the total time for the detector to receive pulsar photons is Tob s, we can divide it into Np segments according to the estimated period, P, and then divide each segment into Nb parts, with each part called a “bin”. The specific folding process is as follows. First, we determine the value of the estimated period, P, divide the observation time into Np segments, and superimpose the photons in each segment into the first segment. Second, we count the number of photons in each bin in the first paragraph, superimpose the probability of occurrence of the energy carried by the photons as a weight, and calculate the weighted sum of the energy information in each bin. Finally, a normalization is performed to obtain the pulsar profile model as follows (the specific process is shown in Fig. 2):
![Mathematical equation: $\[n_{\mathrm{E}}\left(t_i\right)=\frac{1}{N_p \cdot T_b} \cdot \sum_{j=1}^{N_p} P_{\text {pow/exp},j}(E; t_i) \quad i=1,2, \ldots, N_{\mathrm{b}},\]$](/articles/aa/full_html/2024/06/aa48454-23/aa48454-23-eq2.png) (2)
(2)
where Tb represents the time of each part in Tob, and Ppow/exp,j(E; ti) represents the probability of the energy carried by the photon in the i-th bin in the j-th time period appearing.
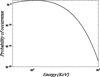 |
Fig. 1 Fitting curve of pulsar photon energy distribution. |
2.2 Profile phase-shift model
In actual navigation missions, the period of the pulsar is constantly changing, so the structural characteristics of the outline obtained by folding the standard period of the pulsar will also have phase shifts. In order to improve the matching efficiency of structural features, this paper performs a cross-correlation operation on the folded pulsar profile and the standard phase profile. The phase difference between the two is calculated, and the folded profile is moved to the standard phase for subsequent structural feature matching using a fixed template.
In Sec. 2.1, we describe how the pulsar profile is obtained after epoch folding using the photon energy information is nE(ti). We let the profile at the standard phase be sE(ti), and the bin number value be Nb. The cyclic cross-correlation operation is defined as:
![Mathematical equation: $\[p h(m)=\sum_{b=1}^{N_{\mathrm{b}}} n_{\mathrm{E}}\left(t_{i+m}\right) \cdot s_{\mathrm{E}}\left(t_i\right) \quad m=1,2, \ldots, N_{\mathrm{b}},\]$](/articles/aa/full_html/2024/06/aa48454-23/aa48454-23-eq3.png) (3)
(3)
where ph(m) represents the cross-correlation operation value of the folded profile and the standard profile when the phase is shifted m.
The phase shift correction value of the folded profile can be expressed as:
![Mathematical equation: $\[\theta=\underset{m \in 1,2, \ldots, N_{\mathrm{b}}}{\operatorname{argmax}} p h(m).\]$](/articles/aa/full_html/2024/06/aa48454-23/aa48454-23-eq4.png) (4)
(4)
Therefore, the pulsar profile after phase shift correction can be expressed as nE(ti+θ).
3 Reverse space-filling curve encoding
Traditional period estimation methods usually process 1D pulsar profile signals, but processing in a 1D space still comes with problems, such as unclear features and limited analysis methods. Therefore, this paper converts the 1D profile signal into 2D image information for period estimation. First of all, 2D images contain richer feature information and can capture more spatial features and texture information. At the same time, 2D information has a stronger capability of identifying interference noise and can be better applied to pulsar information detection tasks with a lot of background noise. This paper mainly uses reverse SFC encoding to convert the dimension of pulsar profile information.
A space-filling curve is a mathematical structure used to map multi-dimensional spatial information onto a 1D curve. This kind of curve usually has the characteristics of continuity and self-similarity, and can map multi-dimensional spatial information onto a 1D plane according to certain rules (Ma et al. 2022), thereby facilitating the processing and analysis of multidimensional spatial information. Therefore, SFC encoding is a fast dimensionality-reduction processing method. Based on the feature that SFC can convert information dimensions and ensure local continuity, this paper uses reverse SFC encoding to convert the 1D pulsar profile information into 2D image information, and then uses the image structure characteristics to analyze the pulsar period.
A space-filling curve has many construction methods, such as Hilbert-SFC, Peano-SFC, Z-SFC, and so on. Among them, Hilbert-SFC offers the best local continuity performance and the fastest encoding speed (Ma et al. 2022). Also, it can better capture the characteristics of the double-peak structure of the pulsar profile. Therefore, this article mainly uses Hilbert-SFC to realize the conversion of pulsar profile information dimensions:
![Mathematical equation: $\[\left(x_0, y_0\right)=H^{-1}(t_0),\]$](/articles/aa/full_html/2024/06/aa48454-23/aa48454-23-eq5.png) (5)
(5)
where H−1 (·) represents reverse Hilbert-SFC encoding, t0 represents the 1D time information before conversion, and (x0,y0) represents the 2D image position coordinates obtained after conversion.
Figure 3 shows the 2D profile image obtained after reverse SFC encoding of standard 1D profiles and non-standard 1D profiles of the PSR B0531+21 pulsar. This work mainly uses the Hilbert-SFC template structure of 16 × 16 size in the encoding process, so it needs to meet the 1D outline length of the pulsar as 1 × 256, that is, the number of bins of the pulsar in the epoch folding process is 256.
According to the reverse SFC encoding process in Fig. 3, it can be found that the 1D profile information obtained by folding according to the pulsar standard profile has obvious bimodal structural characteristics. There are also obvious structural features in area A and area B of its 2D image. The 2D image obtained by folding according to non-standard periods does not have such structural characteristics. Therefore, reverse SFC encoding can be used to convert the 1D pulsar profile information into 2D image information without losses. This facilitates the subsequent extraction and matching of structural features of the pulsar’s 2D image information.
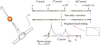 |
Fig. 2 Schematic diagram of weighted epoch folding. |
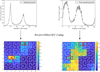 |
Fig. 3 Schematic diagram of the reverse SFC encoding. |
4 Structural characteristic matching
Reverse SFC encoding can be used to convert the 1D profile information of the pulsar into 2D image information, so that the folded profile of the pulsar can be analyzed from an image perspective. There are many methods to identify the structural features of pulsar images (Wang et al. 2017; Chang et al. 2023; Yoo et al. 2014), such as template matching, PCA, neural networks, scale-invariant feature transformation, and so on.
This paper mainly uses the template matching method to identify the profile images to accurately estimate the pulsar period. First, template matching has better local feature capture performance. Most of the pulsar folding profiles have a single-peak or double-peak structure, and the image information obtained through reverse SFC encoding still has obvious local characteristics. The template matching method uses the standard template to compare the correlation with these local features, thereby identifying the image obtained by the standard period folding. Second, template matching has high computational efficiency and good real-time performance. For actual navigation tasks, real-time performance is a key factor affecting navigation performance. Template matching directly matches and analyzes the standard template with the local features of the pulsar image, greatly reducing the calculation time and improving the calculation efficiency. At the same time, the template matching method has strong robustness. In actual navigation tasks, the background noise received by the detector is relatively large, which will cause the pulsar image information to contain a large amount of interference noise. Template matching is a relatively in-depth recognition and matching of local features, which is not sensitive to the impact of global interference, and can show strong anti-interference ability for features with certain regularity. Therefore, it is feasible to use template matching method to analyze the structural characteristics of pulsar image information.
Figure 4 shows the local feature information of the pulsar profile image obtained by folding the standard period of the PSR B0531+21 pulsar. Since the image has relatively obvious structural features in area A and area B, the above two target areas can be selected as the standard template for the PSR B0531+21 pulsar.
There are many methods to measure the correlation between standard templates and local features (Omachi & Omachi 2007; Mattoccia, et al. 2011; Spratling et al. 2020), such as the sum of squared differences (SSD) matching principle, normalized sum of squared differences (NSSD) matching principle, Pearson correlation coefficient (PCC) matching principle, and so on. This work mainly deals with the PCC matching principle. First, the PCC matching principle has a high level of accuracy and it can aptly capture the degree of linear correlation between the template and the target. Structural features such as pulsar profiles are relatively fixed and more obvious targets have better recognition capabilities. Second, the PCC matching principle has strong anti-interference ability. It can comprehensively consider the mean and standard deviation of the template and the target, and has good robustness when dealing with noise and deformation. At the same time, standardization processing can normalize the numerical range of the target and the template to the same scale, which is beneficial to reducing the numerical difference between the target and the target and improving the accuracy of matching. Therefore, the PCC matching principle is more suitable for the identification of pulsar profile images.
In this paper, PCC-based matching consists of matching the relative value of the template to its mean with the relative value of the target to its mean. Letting T(x, y) be a target image with a size of M × N pixels, S(x, y) be a template image with a size of M × N pixels, S(x′, y′) be a point in the current template, and T(x′, y′) be a point in the target image – the PCC can be expressed as (Debella-Gilo et al. 2012):
![Mathematical equation: $\[\mathrm{PCC}=\frac{\sum_{x^{\prime}, y^{\prime}}\left(S^{\prime}\left(x^{\prime}, y^{\prime}\right)\right) \cdot\left(T^{\prime}\left(x^{\prime}, y^{\prime}\right)\right)}{\sqrt{\sum_{x^{\prime}, y^{\prime}} S^{\prime}\left(x^{\prime}, y^{\prime}\right)^2 \cdot \sum_{x^{\prime}, y^{\prime}} T^{\prime}\left(x^{\prime}, y^{\prime}\right)^2}},\]$](/articles/aa/full_html/2024/06/aa48454-23/aa48454-23-eq6.png) (6)
(6)
where ![Mathematical equation: $\[S^{\prime}\left(x^{\prime}, y^{\prime}\right)=S\left(x^{\prime}, y^{\prime}\right)-\frac{1}{MN} \cdot ~\sum{_{x^{\prime}, y^{\prime}}} ~S(x, y), ~T^{\prime}\left(x^{\prime}, y^{\prime}\right)=T\left(x^{\prime}, y^{\prime}\right)-\frac{1}{M N} \cdot ~\sum{_{x^{\prime}, y^{\prime}}} ~T(x, y)\]$](/articles/aa/full_html/2024/06/aa48454-23/aa48454-23-eq7.png) .
.
When using the PCC principle for matching, PCC = 1 means the best matching effect, PCC = −1 means the worst matching effect, and PCC = 0 means there is no correlation between the two. Therefore, by performing PCC matching and comparison on the profile images obtained by folding different periods, and selecting the target image with the best matching effect, the optimal period of the pulsar can be determined. The method flow of the optimal period estimation of PETM pulsar proposed in this article is shown in Fig. 5.
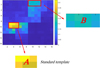 |
Fig. 4 Local feature information of pulsar profile image. |
Simulation parameter selection.
Detector performance parameters.
5 Experimental results and analysis
This paper conducts experimental analyses of the PETM method from two aspects: simulation experiment and actual measurement data analysis. The experiment selected the X-ray pulsar PSR B0531+21 as the navigation pulsar. PSR B0531+21 is a relatively young neutron star located at the center of the Crab Nebula. It has strong signal radiation capability in a wide energy range (Karuppusamy et al. 2010) and is more suitable for the observation of navigation signals. The specific parameters selected for the simulation experiment are shown in Table 1. In the actual measurement data analysis, this paper selects the observation data of the China Pulsar Navigation Experiment 01 (XPNAV-1) satellite from 17 November 2016–19 December 2016 (UTC) for experimental analysis. The performance parameters of the X-ray detector used by the XPNAV-1 satellite are shown in Table 2.
To evaluate the period estimation performance of the method proposed in this paper, we first conducted simulation experiments and analysis on the period estimation method of weighted epoch folding using energy distribution characteristics (see Sect. 5.1). We used the PETM method to conduct simulation experiments and compares it with the traditional period estimation method (Sect. 5.2). We mainly conducted simulation experiments for various types of noise interference, such as additive noise and multiplicative noise (Sect. 5.3). This analysis demonstrates the period estimation capability of the PETM method from the perspective of anti-noise performance. In Sect. 5.4, we describe the period estimation experiments from the two aspects of observation duration and detector detection capability. We therefore compare the PETM method with traditional method from the perspective of robust performance for data quality. Section 5.5 describes our simulation, followed by a discussion on the problem of glitch in rotation period of some pulsars. In Sect. 5.6, we describe how we used the PETM method to analyze the period estimation performance of the measured data obtained by the XPNAV-1 satellite.
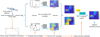 |
Fig. 5 Schematic diagram of PETM method. |
Mean period estimation errors of the two methods under different cosmic background noise flows.
5.1 Simulation analysis of χ2-test method based on energy distribution folding
In Sect. 2.1, we propose a pulsar profile model that uses energy probability distribution characteristics as the weighted value basis for epoch folding. This section conducts a simulation and quantitative analysis of the folding effect of the model (χ2-test method based on photon energy distribution folding, χ2-PE) in Sect. 2.1, and compares it with the traditional method, that is, χ2-test method based on photon number folding. The article is under the condition of different cosmic background noise flows (0.5, 1, 1.5, 2, 2.5, and 3 ph cm−2 s−1), using the above two methods to conduct hundreds of Monte Carlo simulations. Table 3 shows the average period estimation error of the traditional method and χ2-PE method under six different cosmic background noise flows. Figure 6 is a histogram comparison chart of period estimation accuracy.
Combining Table 3 and Fig. 6, it can be seen that as the cosmic background noise flow increases, the average period estimation errors of the two methods show varying degrees of growth, but the period estimation accuracy of the χ2-PE method is always better than that of the traditional method. When the cosmic background noise flow is 0.5 ph cm−2 s−1, the period estimation accuracy of the χ2-PE method is 22.10% higher than that of the traditional method. When the cosmic background noise flow is 3 ph cm−2 s−1, the period estimation accuracy of the χ2-PE method is 42.41% higher than that of the traditional method. This shows that the traditional method is more sensitive to noise, while the χ2-PE method has stronger anti-noise performance. This is because the traditional method uses photon number information to perform equal-weighted profile folding. When the flow of noise photons is large, the true profile of the pulsar will be “submerged” in the noise photons and will not be able to display significant periodic changes. However, the χ2-PE method uses photon energy probability distribution information for weighted profile folding to limit the impact of noise photons on the true profile of the pulsar to the greatest extent, thus achieving the effect of improving the accuracy of pulsar period estimation. This proves the effectiveness of the χ2-PE method from the perspective of data calculation results.
Figure 7 is a profile rendering obtained by folding by the two methods under different cosmic background noise flows. It can be found from the figure that as the cosmic background noise flow continues to increase, the profile curves folded by the two methods show varying degrees of lifting. However, since the traditional method uses photon number information for equal-weighted accumulation, the increase in cosmic background noise will lead to a continuous decrease in the signal-to-noise ratio (S/N) of the profile, and the period estimation accuracy will gradually decrease. However, although the χ1-PE method is also affected by the size of the background noise, it can also be found from the figure that the profile curve folded by the χ2-PE method rises relatively slowly. This is because the use of energy probability distribution for weighted epoch folding can weaken the influence of noise photons and enhance the S/N of the profile, thereby achieving the effect of resisting noise. This also once again confirms the superiority of the χ2-PE method from the perspective of profile restoration effect.
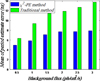 |
Fig. 6 Histogram comparison of period estimation accuracy of two methods. |
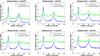 |
Fig. 7 Two methods folding profile effect comparison diagram. |
5.2 Simulation experiment analysis based on PETM method
This paper uses the PETM method to estimate the pulsar period and combines the photon energy information to fold the pulsar profile. By comparing the phase of the folded profile with the standard profile, the phase accuracy of the pulsar profile is calculated to obtain the pulsar TOA information, which is used as a quantity measurement for subsequent navigation processing. Therefore, this paper analyzes and evaluates the PETM method from two perspectives: period estimation accuracy and profile phase accuracy. We use Monte Carlo simulations to conduct period estimation experiments. By analyzing the experimental data, we are able to obtain the mean error and the root mean square error (RMSE) between the period and the standard period estimated by the traditional method and the PETM method. As well as the mean error and the RMSE of the profile phase of the two methods. The specific results are shown in Table 4. The distribution of experimental results obtained from the specific simulation experiment is shown in Fig. 8.
According to Table 4, it can be found that the period estimation error using photon number information combined with the traditional method is 4.1780ns, while the period estimation error of the PETM method proposed in this article is 2.0480 ns. In comparison, the period estimation accuracy is improved by 50.98%. This shows that the period estimation performance of the PETM method is better than the traditional method. The RMSE of the period estimation of the PETM method is 2.5554ns, which is an improvement of 51.40% compared with the traditional method. This shows that the period estimation stability of this method is better, it is not susceptible to external noise interference, and it is more suitable for X-ray pulsar signal processing tasks with large background noise. At the same time, the profile phase error of the traditional method is 0.0006699, while the profile phase error of the PETM method is 0.0003679, and the profile phase accuracy is improved by 45.08%. The RMSE of the profile phase of the PETM method is 0.0004507, which is an increase of 49.07% compared with the traditional method. This also shows that the profile phase obtained by the PETM method is more accurate and can obtain higher-precision TOA measurement information, which more intuitively shows that this method can improve the navigation performance of X-ray pulsars.
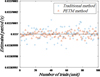 |
Fig. 8 Distribution of simulation results for two methods. |
Comparison of period estimation accuracy and profile phase accuracy results of two methods.
5.3 Analysis of anti-noise performance of PETM method
In actual X-ray pulsar navigation missions, noise interference has a greater impact on pulsar signal detection. Poor anti-interference performance will lead to a decrease in the accuracy of pulsar period estimation, thereby affecting the acquisition of TOA measurement in navigation. The noise of X-ray pulsar signals mainly comes from cosmic background noise, X-ray pulsar periodic noise, X-ray incident process noise, readout noise and pulse noise, and so on. When some scholars study the signal-to-noise characteristics of X-ray pulsar signals, they divide the noise signal into additive noise and multiplicative noise (Hu et al. 2011). Among them, the cosmic background noise, X-ray pulsar periodic noise, readout noise and pulse noise are additive noise, while the X-ray incident process noise is multiplicative noise.
5.3.1 Additive noise
Additive noise refers to a type of noise in which noise is simply added to a signal. In actual detection tasks, additive noise has a great impact on signal detection and recognition. A general signal model containing additive noise can be expressed as:
![Mathematical equation: $\[s(t)=N_a(t)+n(t),\]$](/articles/aa/full_html/2024/06/aa48454-23/aa48454-23-eq8.png) (7)
(7)
where Na(t) is the additive noise and n(t) is the pulsar effective signal.
Cosmic background noise is a typical type of additive noise. Therefore, this article mainly takes cosmic background noise as an example to analyze the resistance of different period estimation methods to additive noise. The cosmic background noise signal interferes greatly, sometimes reaching between five and six times the effective signal of the pulsar. It can be seen that it is very important to analyze the anti-interference ability of the PETM method against the cosmic background noise. Cosmic background noise mainly comes from the superposition of active galactic nuclei radiation in various periods of the universe, and is a common noise faced by X-ray pulsar detection and navigation. This paper mainly uses the homogeneous Poisson model to simulate the arrival time of cosmic background noise photons. The simulation conditions in this section are the same as those in Sec. 5.1. This article selects different cosmic background noise flows (0.5, 1, 1.5, 2, 2.5, and 3 ph cm−2 s−1) and conducts hundreds of Monte Carlo simulations using traditional method and PETM method. The experimental results are shown in Fig. 9.
According to Fig. 9, it can be found that as the cosmic background noise flow continues to increase, the period estimation accuracy of the traditional method decreases significantly. However, compared with the traditional method, the PETM method proposed in this article is not sensitive to cosmic background noise. First, and as explained in Sec. 5.1, the PETM method uses the probability distribution information of photon energy to perform profile weighted folding. This improves the S/N of the pulsar signal to a certain extent and reduces the sensitivity of the pulse signal to background noise interference. Secondly, the traditional method uses the χ2 function as the evaluation criterion for folding profiles. This is a statistical parameter based on profile information and belongs to the template-free evaluation criterion. When the background noise continues to increase, the profile gradually becomes distorted, and the accuracy of period estimation will also decrease. In contrast, the PETM method adopts image template matching as the evaluation criterion. When the background noise increases, this evaluation criterion can still be used to select the profile that best matches the standard template under the noise condition, so that the background noise has less impact on the accuracy of period estimation.
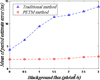 |
Fig. 9 Period estimation error under different cosmic background noise flows. |
5.3.2 Multiplicative noise
In order to more comprehensively discuss the impact of different types of noise on period estimation methods, this article also conducts a preliminary analysis of some non-additive, unknown multiplicative noise. A general signal model containing multiplicative noise can be expressed as
![Mathematical equation: $\[s(t)=N_m(t) * n(t),\]$](/articles/aa/full_html/2024/06/aa48454-23/aa48454-23-eq9.png) (8)
(8)
where Nm(t) is the multiplicative noise, and n(t) is the pulsar effective signal.
The impact of multiplicative noise on pulsar signals is relatively complex. The greater the intensity of the pulsar signal, the greater the multiplicative noise may be (Hu et al. 2011). Therefore, it is also necessary to analyze the resistance of different period estimation methods to multiplicative noise.
We conducted quantitative simulation experiments and analysis on different multiplicative noise signal strengths. We define the noise intensity factor as the ratio of the multiplicative noise intensity to the effective signal intensity, and the article selects different noise intensity factors (0, 0.2, 0.4, 0.6, 0.8). Hundreds of Monte Carlo random simulation experiments were conducted using traditional methods and PETM method. The experimental results are shown in Fig. 10.
According to Fig. 10, we see that as the multiplicative noise intensity increases, the accuracy of the two period estimation methods shows varying degrees of decline. However, the period estimation accuracy of the PETM method is always better than that of the traditional method. This is because the multiplicative noise will increase as the pulse signal becomes stronger. For example, in the peak section of the pulse signal, the multiplicative noise may be stronger. This will increase the difficulty in extracting effective photons for contour folding, making period estimation using the traditional χ2 function ineffective. The PETM method not only considers contour shape differentiation, but also incorporates standard contours into the evaluation criteria. This shows that compared with traditional estimation method, the PETM method has a stronger ability to suppress contour deformation. Therefore, the performance of the PETM period estimation method against multiplicative noise is better than that of the traditional method.
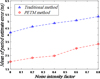 |
Fig. 10 Period estimation error under different multiplicative noise intensities. |
5.4 Analysis of data quality factors of PETM method
When estimating the pulsar period, the quality of the observation data directly affects the accuracy of the period estimation. This section mainly quantitatively analyzes the robust performance of the PETM method for data quality from two aspects: observation duration and detector detection performance (effective area).
5.4.1 Observation duration
The length of observation time directly determines the number of photons received by folding, which is of great significance to the accuracy of period estimation. This paper sets the observation duration to 200, 400, 600, 800, 1000, 1200, and 1400s respectively, uses the PETM method to estimate the period, and conducts comparative analysis with the traditional method. The experiments were also conducted using the Monte Carlo simulation method. The specific simulation parameter settings are shown in Table 1 and the experimental results are shown in Fig. 11.
Figure 11 shows the period estimation errors of the traditional method and the PETM method obtained by using different observation durations for period estimation. It can be found from the Fig. 11 that as the observation duration increases, the period estimation accuracy of the two methods increases. This is because as the observation time increases, the number of photons involved in folding also increases, and the influence of unstable factors such as noise particles is gradually weakened, making the folded pulsar profile closer to the standard profile. At the same time, it can also be found that the period estimation accuracy of the PETM method proposed in this article is better than the traditional method under any observation duration, which further proves that the period estimation performance of the PETM method is better. Figure 12 shows the pulsar profiles obtained by folding the PETM method when the observation durations are 200 s and 1400 s respectively.
It can be seen from Fig. 12 that the profile obtained by folding when the observation duration is 1400 s is better. Compared with the profile obtained by folding when the observation duration is 200 s, the noise is smaller and the profile is more stable. This is precisely because when the observation duration is 200 s, the number of photons received is small and the influence of noise particles is greater, causing the folded profile to be unstable and deviate from the real profile.
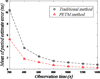 |
Fig. 11 Period estimation error under different observation durations. |
5.4.2 Detector effective area
In addition to the observation time, the size of the effective area of the detector also directly affects the number of photons received. In this article, the detector detection areas are set to 8.2, 10.5, 16, 21, and 42 cm−2, respectively. The PETM method is used to conduct period estimation simulation experiments and compared with traditional method. The experimental results are shown in Fig. 13.
According to Fig. 13, it can be seen that when the effective area of the detector gradually increases, the period estimation errors of the two methods gradually decrease, and the period estimation accuracy increases accordingly. This is because the increase in the effective area of the detector will result in the detector having a greater probability of receiving more pulsed effective photons per unit time, thus making the quality of the observation data more robust. At the same time, Fig. 13 can also draw the same conclusion as above, that is, the period estimation performance of the PETM method is better than the traditional method.
5.5 Analysis of pulsar periodic glitch phenomenon
The rate of change of the spin period of most pulsars is relatively stable (including the PSR B0531+21 pulsar). Therefore, in most cases, auxiliary period estimation can be performed by fitting multiple periods. The Taylor expansion of period estimation (frequency estimation) is
![Mathematical equation: $\[v(t)=v_0+\dot{v}_0\left(t-t_0\right)+\frac{1}{2} \ddot{v}_0\left(t-t_0\right)^2+\ldots,\]$](/articles/aa/full_html/2024/06/aa48454-23/aa48454-23-eq10.png) (9)
(9)
where υ0 is the initial spin frequency of the pulsar, ![Mathematical equation: $\[\dot{v}_0, \ddot{v}_0\]$](/articles/aa/full_html/2024/06/aa48454-23/aa48454-23-eq11.png) is the change rate of the first-order and second-order spin frequencies of the pulsar respectively, and t0 is the reference epoch time.
is the change rate of the first-order and second-order spin frequencies of the pulsar respectively, and t0 is the reference epoch time.
Take the PSR B0531+21 pulsar from November 2020 to July 2022 as an example. Figure 14 shows a comparison of the results of the period estimated using the PETM method, the period obtained using Taylor expansion fitting, and the Jodrell Bank Observatory radio signal observation period (usually considered a relatively standard period of pulsars).
According to Fig. 14, it can be seen that when the spin change rate of the selected pulsar is relatively stable, the estimated period obtained by fitting and predicting the Taylor expansion is basically consistent with the standard period observed by the radio signal of the Jodrell Bank Observatory. Therefore, when estimating the period of such pulsars, fitting multiple periods can assist the PETM method to estimate the period more quickly and accurately.
However, long-term monitoring has revealed that some magnetars and rotationally powered pulsars with relatively strong magnetic fields (including the PSR J1119-6127 pulsar) will cause a sudden change in the pulsar’s rotation period (glitch) due to X-ray bursts. The observable transition of pulsars is ΔP/P ~ 10−10 − 10−6ss−1, and more than 570 period transition phenomena have been discovered in more than 190 pulsars (Wang et al. 2020). Among them, the periodic glitch phenomenon of PSR J1119-6127 pulsar is relatively frequent. This paper simulates the period changes of the PSR J1119-6127 pulsar from March 2016 to June 2017 (Antonopoulou et al. 2015, Dai et al. 2018), and uses the PETM method, Taylor expansion fitting method, and Jodrell Bank Observatory radio observation method to estimate the period.
According to Fig. 15, it can be found that when the selected pulsar undergoes a period jump, there will be a large deviation in predicting the pulsar period using the fitting method. At the same time, compared with using the maximum likelihood method for dynamic period estimation, the PETM method requires less calculation and has better real-time performance. Therefore, in such cases, using the PETM method for real-time dynamic estimation of the pulsar period can improve the stability of the period estimation and provide guarantee for the continuous acquisition of high-precision TOA information.
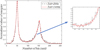 |
Fig. 12 Folding profiles of PETM method under different observation durations. |
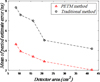 |
Fig. 13 Period estimation error under different detector effective areas. |
5.6 Analysis of actual measurement data based on PETM method
This work uses 121 sets of PSR B0531+21 pulsar data observed by the XPNAV-1 satellite from 17 November 2016 to 19 December 2016 for our experiments. First of all, due to different reference systems and problems such as space-time effects, the data need to be converted and corrected, that is, the PTOA is converted to the TDB time system. Second, the PTOA must corrected to the SSB. Finally, the doppler time delay correction can be performed on the PTOA based on the spacecraft velocity. Using the PTOA time correction model (see Appendix A), the photon arrival time series can be corrected to the correct precise time that can be used directly for profile folding. The effect of profile folding before and after correction by using the time conversion model is shown in Fig. 16.
After completing the PTOA time correction, we used the photon number information combined with traditional detection method and PETM method to estimate the period of 121 sets of observation data. And compared with the periodic observation results released by the Jodrell Bank Observatory in the UK. The mean error and RMSE between the obtained period and the simulation period, and the average error and RMSE of the profile phase are shown in Table 5.
According to Table 5, it can be found that the average period estimation error obtained by using the traditional method is 9.6817 ns, while the average period estimation error of the PETM method is 4.8190 ns and the period estimation accuracy is improved by 50.23%. The RMSE of the period estimation of the PETM method is 6.2712 ns, which is an improvement of 73.69% compared with the traditional method. The larger RMSE of the period estimation of the traditional method shows that it is unstable for period estimation in actual tasks. This is due to the high level of noise and short observation time in a certain observation mission, which leads to large fluctuations in the accuracy of period estimation using the traditional method. The PETM method performs deep matching of image feature structures based on the PCC principle rather than directly identifying based on the statistical characteristics of the profile. Therefore, it is more conducive to searching for deep structural features and reducing the impact of interference factors, such as noise and observation time. At the same time, the profile phase accuracy of the PETM method is 41.92% higher than that of the traditional method, which more intuitively shows that the navigation performance of the PETM method is better than the traditional method. This is consistent with the conclusion obtained in the simulation stage of this article.
Figure 17 specifically shows the comparison between the period estimation results of the above 121 sets of measured data using two methods and the radio signal period of the Jodrell Bank Observatory. It is worth noting that the period estimation results obtained by using traditional method will have large deviations in individual observation periods such as Group 5 and Group 112 (the observation duration is less than 500 s). Among them, the period estimation error obtained by the 112th group using the traditional method is 236.4198 ns, while the period estimation error obtained using the PETM method is 22.8802 ns, which is an increase of 90.32%. At the same time, Fig. 18 specifically shows a comparison of the profiles obtained by folding the 112th group of data using the traditional method and using the PETM method. According to Fig. 18, it can be found that when the quality of the observation data is poor or the noise interference is large, the profile obtained by folding using the traditional method has a greater degree of distortion. This is because the traditional method evaluates the effect of folded profiles based on the principle of maximizing profile differences. Although this evaluation method is more versatile and convenient, it is more sensitive to noise. When the data quality is poor, effective pulsar signals cannot be obtained for profile folding. The PETM method can extract the effective information of the pulsar to the greatest extent and restore the pulsar profile. Consistently with the conclusion of the simulation experiment described in Sect. 5.3, this also demonstrates the effectiveness of the PETM method in resisting noise interference and poor data quality from the perspective of actual data.
Figure 19 shows the overall folding outline of 121 sets of measured data. Comparing the overall folded profile with the standard profile, we find that the similarity between the two can reach 99.15%. This shows that the profiles folded by using the PETM method for period estimation are basically close to the real profiles, which are more suitable for pulsar signal processing in actual missions and can play an important role in improving the performance of X-ray pulsar navigation.
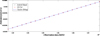 |
Fig. 14 Dynamic period estimation results of PSR B0531+21 under three methods. |
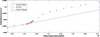 |
Fig. 15 Dynamic period estimation results of PSR J1119-6127 using three different methods. |
Comparison of period estimation accuracy and profile phase accuracy results of two methods.
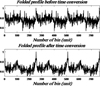 |
Fig. 16 Comparison of folded profiles before and after time correction. |
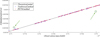 |
Fig. 17 Dynamic period estimation results of two methods. |
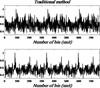 |
Fig. 18 Folded profiles of Group 112 data using two estimation methods. |
6 Conclusion
This paper proposes a pulsar period dynamic estimation method based on photon energy distribution folding and image template matching. First, this paper uses photon energy distribution information to perform epoch folding of the pulsar PTOA signal. Secondly, the 1D profile information is converted into 2D image information through the reverse SFC curve. At the same time, the target area in the image is extracted and template matched with standard features. Finally, the folding profile is selected according to the PCC matching criterion to achieve the estimation of the optimal period. This paper also uses simulation data and measured data to verify the PETM method, and analyzes the factors that affect the accuracy of period estimation.
This method has the following four advantages: (1) high accuracy for the period estimation. In the simulation experiment under relatively ideal conditions, the period of the PETM method proposed in this article was estimated to be 2.0480 ns, which is 50.98% higher than the traditional method; (2) excellent stability. The RMSE of the period estimation accuracy of the PETM method proposed in this article is 2.5554 ns, which is 51.40% higher than the traditional method, indicating that the estimation results of the PETM method are more stable; (3) strong anti-interference ability. Compared with the traditional method, the PETM method is better for period estimation under conditions with high levels of noise, and is more adaptable to actual deep space exploration missions with large background noise; and (4) excellent dynamic estimation performance. The period dynamic estimation of the measured data shows that the period of the PETM method is estimated to be 4.8190 ns, which is still 50.23% higher than the traditional method.
In summary, the PETM method proposed in this article has the advantages of high estimation accuracy, stable estimation performance, strong anti-interference ability, and excellent dynamic estimation performance, demonstrating its capability to further improve the performance of X-ray pulsar navigation.
At the same time, we believe that the period estimation method based on the Z2-test function will have great application prospects, especially in actual detection tasks with a high level of noise. Compared with the traditional epoch folding method, this method may show better performance in X-ray pulsar navigation in the future. Therefore, in the future, we will also conduct in-depth research on the Z2-test function and try to use it in the profiles obtained by folding the photon energy distribution proposed in this article to achieve the goal of improving the navigation performance of X-ray pulsars.
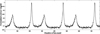 |
Fig. 19 Overall 121 groups of optimal folding profiles. |
Acknowledgements
The research presented in this paper has been supported by the National Natural Science Foundation of China under Grant No.62373030 and No.42388101; and in part by the Fundamental Research Funds for the Central Universities under Grant No.YWF-22-L-835 and No.YWF-23-L-826; and the Innovation Program for Quantum Science and Technology under Grant No.2021ZD0303400. The authors wish to express their gratitude to all members of the Science and Technology on Inertial Laboratory, Basic Science on Novel Inertial Instrument and Navigation system Technology Laboratory, Hangzhou Innovation Institute of Beihang University, and Key Laboratory of extremely weak magnetic Space and Application Technology, for their valuable comments. At the same time, the authors are also very grateful to the reviewer for providing valuable comments.
Appendix A PTOA conversion model
Due to different reference systems, space-time effects, Doppler effects, and other problems, the received PTOA needs to be transformed and corrected before it can be used for profile folding. Therefore, we systematically collate the time delay terms used for PTOA sequence correction here. PTOA transformation model is built. Our aim is that the PTOA sequence received by the detector can be corrected directly to accurate time information for profile folding through this model.
General relativity distinguishes time into proper time and coordinate time. The inherent time will change with the difference of the observed spatial position and movement speed, and can only be applied in the local coordinate system. The coordinate time is the time defined in the entire reference system space. The PTOA received by the pulsar detector is the inherent time information of the spacecraft in the local coordinate system. Therefore, to compare this result with the pulsar standard template to obtain navigation quantity measurement TOA information, it is first necessary to convert PTOA into coordinate time information in the SSB reference system. In the actual pulsar navigation system, the corresponding coordinate system should be used according to the detection tasks and targets on different scales. For exploration missions in the solar system, the SSB and the Earth’s center of mass are often used as reference frames. This work aims to apply X-ray pulsar navigation to deep space exploration missions, so the SSB is still chosen as the reference frame. In addition, the propagation time delay caused by large-scale space-time effects cannot be ignored, so the time delay needs to be corrected for the converted coordinates. Only the time-converted PTOA information can be epoch folded to restore the outline of the pulsar. The time conversion for PTOA mainly needs to consider the influence of three factors, described below.
Appendix A.1 Einstein delay
To eliminate the influence of spatial position, movement speed and other factors on PTOA data, it is first necessary to convert the PTOA information in the local coordinate system received by the detector into coordinate time information in the SSB reference system. The time correction from proper time to coordinate time is called Einstein delay correction, which can be completed through the four-dimensional (4D) space-time relativity theory. The Einstein delay is specifically expressed as (Thompson et al. 2002; Zhu et al. 2019; Li & Ke 2009):
![Mathematical equation: $\[\begin{aligned}\Delta_{\mathrm{E}} & =\frac{1}{c^2} \cdot \int_{t_0}^t\left[\sum\left(\frac{G M_i}{p_i^{\mathrm{SC}}}\right)+\frac{v_{\mathrm{E}}^2}{2}+\Delta L_{\mathrm{C}}^{~~(\mathrm{PN})}+\Delta L_{\mathrm{C}}^{~~(\mathrm{A})}\right] d t \\& +\frac{r_{\mathrm{SC} / \mathrm{E}} \cdot v_{\mathrm{E}}+W_0 \cdot \tau_{\mathrm{SC}}}{c^2},\end{aligned}\]$](/articles/aa/full_html/2024/06/aa48454-23/aa48454-23-eq12.png) (A.1)
(A.1)
where the first term is the time correction between the Earth and SSB, and the second term is the time correction between the spacecraft and the Earth; ![Mathematical equation: $\[\sum\left(G M_i / p_i^{\mathrm{SC}}\right)\]$](/articles/aa/full_html/2024/06/aa48454-23/aa48454-23-eq13.png) represents the gravitational potential of other celestial bodies in the solar system at the center of the earth; GMi is the gravitational constant of celestial body, i;
represents the gravitational potential of other celestial bodies in the solar system at the center of the earth; GMi is the gravitational constant of celestial body, i; ![Mathematical equation: $\[p_i^{\mathrm{SC}}\]$](/articles/aa/full_html/2024/06/aa48454-23/aa48454-23-eq14.png) is the distance from the spacecraft to celestial body i; νE is the velocity of the earth’s center of mass relative to the SSB; ΔLC (PN), ΔLC (A) is the relativistic correction high-order term; rSC/E is the position coordinate of the spacecraft relative to the earth’s center of mass; W0 is the gravity potential and rotation potential at the earth’s center of mass; and τSC is the observation proper time at the spacecraft.
is the distance from the spacecraft to celestial body i; νE is the velocity of the earth’s center of mass relative to the SSB; ΔLC (PN), ΔLC (A) is the relativistic correction high-order term; rSC/E is the position coordinate of the spacecraft relative to the earth’s center of mass; W0 is the gravity potential and rotation potential at the earth’s center of mass; and τSC is the observation proper time at the spacecraft.
Appendix A.2 Roemer delay
In the coordinate time scale, in order to convert the PTOA information to the SSB, the Roemer delay needs to be considered first. The Roemer delay mainly includes the geometric delay and annual parallax, specifically expressed as (Thompson et al. 2002; Zhu et al. 2019; Li & Ke 2009):
![Mathematical equation: $\[\begin{aligned}\Delta_{\mathrm{R}} & =\frac{\boldsymbol{n} \cdot \boldsymbol{r}_{\mathrm{SC} / \mathrm{SSB}}}{c}+\frac{1}{2 c D_0}\left[\left(\boldsymbol{n} \cdot \boldsymbol{r}_{\mathrm{SC} / \mathrm{SSB}}\right)^2-\left(\boldsymbol{r}_{\mathrm{SC} / \mathrm{SSB}}\right)^2\right. \\& \left.+2(\boldsymbol{n} \cdot \boldsymbol{b})\left(\boldsymbol{n} \cdot \boldsymbol{r}_{\mathrm{SC} / \mathrm{SSB}}\right)-2\left(\boldsymbol{b} \cdot \boldsymbol{r}_{\mathrm{SC} / \mathrm{SSB}}\right)\right],\end{aligned}\]$](/articles/aa/full_html/2024/06/aa48454-23/aa48454-23-eq15.png) (A.2)
(A.2)
where n is the line of sight direction vector of the pulsar, n = D0/D0 and D0 are the distances between the SSB and the pulsar, rSC/SSB is the position vector of the spacecraft under the SSB, and b represents the position vector of the sun’s center of mass under the SSB.
Appendix A.3 Shapiro delay
When a signal propagates within the solar system, massive objects will cause the signal propagation trajectory to bend. The time delay due to orbital curvature is called gravitational time delay, or Shapiro delay. The sum of Shapiro delays of massive objects in the solar system is (Thompson et al. 2002; Zhu et al. 2019; Li & Ke 2009)
![Mathematical equation: $\[\Delta_{\mathrm{S}}=-2 \sum_i \frac{G M_i}{c^3} \ln \left[\frac{\boldsymbol{n} \cdot \boldsymbol{b}_i+b_i}{\boldsymbol{n} \cdot \boldsymbol{D}_i+D_i}\right]+2 \sum_i \frac{G M_i}{c^3} \ln \left[\frac{\boldsymbol{n} \cdot \boldsymbol{p}_i+p_i}{\boldsymbol{n} \cdot \boldsymbol{D}_i+D_i}\right],\]$](/articles/aa/full_html/2024/06/aa48454-23/aa48454-23-eq16.png) (A.3)
(A.3)
where i is the number of massive celestial bodies in the solar system, Di represents the position vector between celestial body i and the pulsar, and pi represents the position vector between celestial body i and the spacecraft. Since the solar Shapiro delay is much larger than the Shapiro delays of other celestial bodies, the PTOA time conversion model in this article only considers the impact of the solar Shapiro delay.
The PTOA conversion model considering time conversion and delay correction can be expressed as:
![Mathematical equation: $\[\begin{aligned}t_{\mathrm{SSB}} & =t_{\mathrm{ob}}+\Delta_{\mathrm{E}}+\Delta_{\mathrm{R}}+\Delta \mathrm{S} \\& =t_{\mathrm{ob}}+\frac{1}{c^2} \cdot \int_{t_0}^t\left[\sum\left(\frac{G M_i}{p_i^{\mathrm{SC}}}\right)+\frac{v_{\mathrm{E}}^2}{2}+\Delta L_{\mathrm{C}}{ }^{(\mathrm{PN})}+\Delta L_{\mathrm{C}}^{~~(\mathrm{A})}\right] d t \\& +\frac{\boldsymbol{r}_{\mathrm{SC} / \mathrm{E}} \cdot \boldsymbol{v}_{\mathrm{E}}+W_0 \cdot \tau_{\mathrm{SC}}}{c^2} \\& +\frac{\boldsymbol{n} \cdot \boldsymbol{r}_{\mathrm{SC} / \mathrm{SSB}}}{c}+\frac{1}{2 c D_0}\left[\left(\boldsymbol{n} \cdot \boldsymbol{r}_{\mathrm{SC} / \mathrm{SSB}}\right)^2-\left(r_{\mathrm{SC} / \mathrm{SSB}}\right)^2\right. \\& ~\left.+2(\boldsymbol{n} \cdot \boldsymbol{b})\left(\boldsymbol{n} \cdot \boldsymbol{r}_{\mathrm{SC} / \mathrm{SSB}}\right)-2\left(\boldsymbol{b} \cdot \boldsymbol{r}_{\mathrm{SC} / \mathrm{SSB}}\right)\right] \\& -2 \sum_i \frac{G M_i}{c^3} \ln \left[\frac{\boldsymbol{n} \cdot \boldsymbol{b}_i+b_i}{\boldsymbol{n} \cdot \boldsymbol{D}_i+D_i}\right]+2 \sum_i \frac{G M_i}{c^3} \ln \left[\frac{\boldsymbol{n} \cdot \boldsymbol{p}_i+p_i}{\boldsymbol{n} \cdot \boldsymbol{D}_i+D_i}\right].\end{aligned}\]$](/articles/aa/full_html/2024/06/aa48454-23/aa48454-23-eq17.png) (A.4)
(A.4)
In summary, after a delay correction of the above three types of errors, accurate PTOA information can be obtained. This facilitates epoch folding processing of the pulsar profile by directly using the time arrival information.
References
- Abdo, A. A., Ackermann, M., Ajello, M., et al. 2010, ApJ, 712, 154 [NASA ADS] [CrossRef] [Google Scholar]
- Antonopoulou, D., Weltevrede, P., Espinoza, C. M., et al. 2015, MNRAS, 447, 3924 [CrossRef] [Google Scholar]
- Bachetti, M., Pilia, M., Huppenkothen, D., et al. 2021, ApJ, 909, 33 [CrossRef] [Google Scholar]
- Buccheri, R., Bennett, K., Bignami, G. F., et al. 1983, A&A, 128, 245 [NASA ADS] [Google Scholar]
- Cassanelli, T., Naletto, G., Codogno, G., et al. 2022, A&A, 663, A106 [NASA ADS] [CrossRef] [EDP Sciences] [Google Scholar]
- Chang, C. I., Liang, C. C., & Hu, P. 2023, IEEE Trans. Geosci. Remote Sens, 61, 5513526 [Google Scholar]
- Chen, P. T., Speyer, J. L., Bayard, D. S., et al. 2017, J. Guid. Control Dyn., 40, 2237 [CrossRef] [Google Scholar]
- Cui, P., Wang, S., Gao, A., et al. 2016, Adv. Space Res., 57, 1889 [CrossRef] [Google Scholar]
- Dai, S., Johnston, S., Weltevrede, P., et al. 2018, MNRAS, 480, 3584 [NASA ADS] [CrossRef] [Google Scholar]
- Debella-Gilo, M., & Kääb, A. 2012, ISPRS J. Photogramm. Remote Sens., 69, 10 [NASA ADS] [CrossRef] [Google Scholar]
- Emadzadeh, A. A., & Speyer, J. L. 2011, Navigation in Space by X-ray pulsars (London: Springer) [CrossRef] [Google Scholar]
- Fang, H., Su, J., Li, L., et al. 2021, Adv. Space Res., 68, 3731 [NASA ADS] [CrossRef] [Google Scholar]
- Hu, H., Zhao, B., Sheng, L., et al. 2011, Acta Opt. Sin., 31, 8 [Google Scholar]
- Jager, D. C., Raubenheimer, B. C., & Swanepoel, J.W. 1989, A&A, 221, 180 [NASA ADS] [Google Scholar]
- Janssen, G. H., Stappers, B. W., Bassa, C. G., et al. 2010, A&A, 514, A74 [NASA ADS] [CrossRef] [EDP Sciences] [Google Scholar]
- Karuppusamy, R., Stappers, B. W., & Van Straten, W. 2010, A&A, 515, A36 [NASA ADS] [CrossRef] [EDP Sciences] [Google Scholar]
- Leahy, D. A., Darbro, W., Elsner, R. F., et al. 1983, ApJ, 266, 160 [NASA ADS] [CrossRef] [Google Scholar]
- Li, J., & Ke, X. 2009, Sci. China G Phys. Mech. Astron., 52, 303 [NASA ADS] [CrossRef] [Google Scholar]
- Li, Z. Z., Zheng, W., & Wang, Y. D. 2023, Acta Aeronaut. Astronaut. Sin., 44, 239 [Google Scholar]
- Liu, J., Ma, J., Tian, J., et al. 2010, Adv. Space Res., 46, 1409 [NASA ADS] [CrossRef] [Google Scholar]
- Liu, J., Yang, Z., Kang, Z., et al. 2019, Acta Astronaut., 160, 90 [CrossRef] [Google Scholar]
- Liu, J., Wang, Y. D., & Ning, X. L. 2023, Acta Astronaut., 213, 373 [NASA ADS] [CrossRef] [Google Scholar]
- Ma, X., Fu, X., Sun, Y., et al. 2022, IEEE Sens. J., 23, 460 [Google Scholar]
- Mattoccia, S., Tombari, F., & Di Stefano, L. 2011, Pattern Recognit. Lett., 32, 694 [CrossRef] [Google Scholar]
- Mickaliger, M. B., McEwen, A. E., McLaughlin, M. A., et al. 2018, MNRAS, 479, 5413 [NASA ADS] [CrossRef] [Google Scholar]
- Ning, X., Gui, M., Fang, J., et al. 2017, Aerosp. Sci. Technol., 62, 36 [NASA ADS] [CrossRef] [Google Scholar]
- Omachi, S., & Omachi, M. 2007, IEEE Trans. Image Process., 16, 2139 [CrossRef] [Google Scholar]
- Spratling, M. W. 2020, Pattern Recognit., 104, 107337 [NASA ADS] [CrossRef] [Google Scholar]
- Thompson, C., Lyutikov, M., & Kulkarni, S.R. 2002, ApJ, 574, 332 [NASA ADS] [CrossRef] [Google Scholar]
- Wang, Q., Gao, Q., Gao, X., et al. 2017, IEEE Trans. Image Process., 27, 1336 [Google Scholar]
- Wang, H. H., Lin, L. C., Dai, S., et al. 2020, MNRAS, 902, 96 [Google Scholar]
- Wang, Y. D., Zhang, S., Ge, M., et al. 2022, IEEE Trans. Aerosp. Electron. Syst., 59, 3395 [Google Scholar]
- Xiong, K., Wei, C. L., & Liu, L.D. 2009, Acta Astronaut., 64, 427 [CrossRef] [Google Scholar]
- Xue, M. F., Li, X. P., Fu, L.Z., et al. 2015, Sci. China Inf. Sci., 12, 1 [CrossRef] [Google Scholar]
- Yan, L. L., Tuo, Y.L., Ge, M. Y., et al. 2022, ApJ, 928, 183 [NASA ADS] [CrossRef] [Google Scholar]
- Yoo, J., Hwang, S.S., Kim, S.D., et al. 2014, Pattern Recognit., 47, 3006 [NASA ADS] [CrossRef] [Google Scholar]
- Zhang, X., Shuai, P., Huang, L., et al. 2018, ApJ, 866, 82 [NASA ADS] [CrossRef] [Google Scholar]
- Zhu, H. X., Tong, M.L., Yang, T. G., et al. 2019, J. Astronaut., 40, 1492 [Google Scholar]
All Tables
Mean period estimation errors of the two methods under different cosmic background noise flows.
Comparison of period estimation accuracy and profile phase accuracy results of two methods.
Comparison of period estimation accuracy and profile phase accuracy results of two methods.
All Figures
|
Fig. 1 Fitting curve of pulsar photon energy distribution. |
| In the text | |
|
Fig. 2 Schematic diagram of weighted epoch folding. |
| In the text | |
|
Fig. 3 Schematic diagram of the reverse SFC encoding. |
| In the text | |
|
Fig. 4 Local feature information of pulsar profile image. |
| In the text | |
|
Fig. 5 Schematic diagram of PETM method. |
| In the text | |
|
Fig. 6 Histogram comparison of period estimation accuracy of two methods. |
| In the text | |
|
Fig. 7 Two methods folding profile effect comparison diagram. |
| In the text | |
|
Fig. 8 Distribution of simulation results for two methods. |
| In the text | |
|
Fig. 9 Period estimation error under different cosmic background noise flows. |
| In the text | |
|
Fig. 10 Period estimation error under different multiplicative noise intensities. |
| In the text | |
|
Fig. 11 Period estimation error under different observation durations. |
| In the text | |
|
Fig. 12 Folding profiles of PETM method under different observation durations. |
| In the text | |
|
Fig. 13 Period estimation error under different detector effective areas. |
| In the text | |
|
Fig. 14 Dynamic period estimation results of PSR B0531+21 under three methods. |
| In the text | |
|
Fig. 15 Dynamic period estimation results of PSR J1119-6127 using three different methods. |
| In the text | |
|
Fig. 16 Comparison of folded profiles before and after time correction. |
| In the text | |
|
Fig. 17 Dynamic period estimation results of two methods. |
| In the text | |
|
Fig. 18 Folded profiles of Group 112 data using two estimation methods. |
| In the text | |
|
Fig. 19 Overall 121 groups of optimal folding profiles. |
| In the text | |
Current usage metrics show cumulative count of Article Views (full-text article views including HTML views, PDF and ePub downloads, according to the available data) and Abstracts Views on Vision4Press platform.
Data correspond to usage on the plateform after 2015. The current usage metrics is available 48-96 hours after online publication and is updated daily on week days.
Initial download of the metrics may take a while.