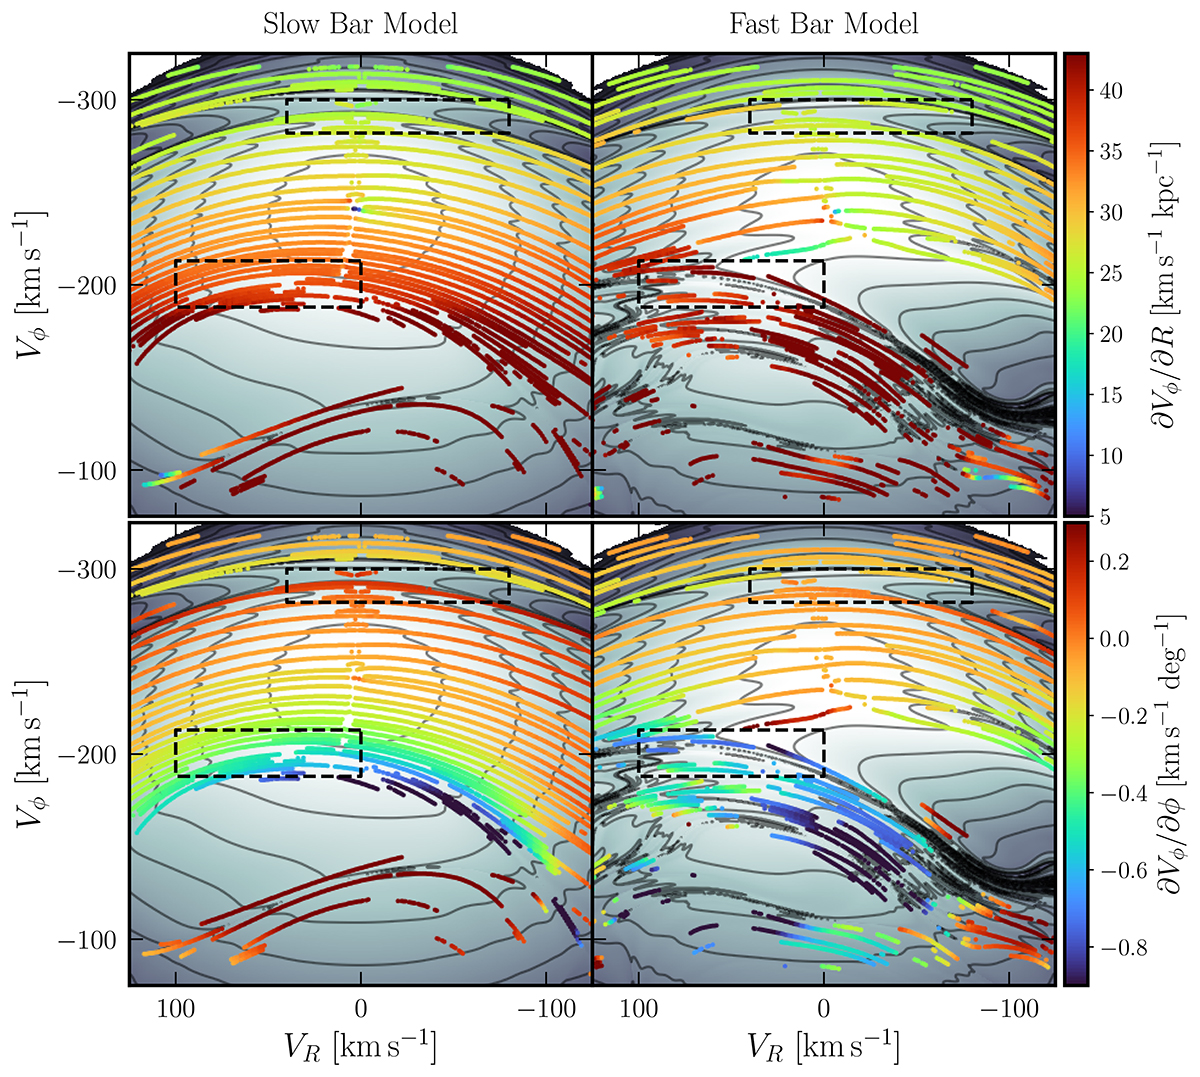
Fig. A.1.
Download original image
Overdensities’ detection in the simulations, for t = 14 bar laps. They are coloured by their ∂Vϕ/∂R (top panels) and ∂Vϕ/∂ϕ (bottom panels) at each VR. The dashed black boxes represent the region of the velocity distribution associated with Hercules and Hat. Left: SBM detection of the overdensities. Right: FBM detection of the overdensites.
Current usage metrics show cumulative count of Article Views (full-text article views including HTML views, PDF and ePub downloads, according to the available data) and Abstracts Views on Vision4Press platform.
Data correspond to usage on the plateform after 2015. The current usage metrics is available 48-96 hours after online publication and is updated daily on week days.
Initial download of the metrics may take a while.