Fig. 6.
Download original image
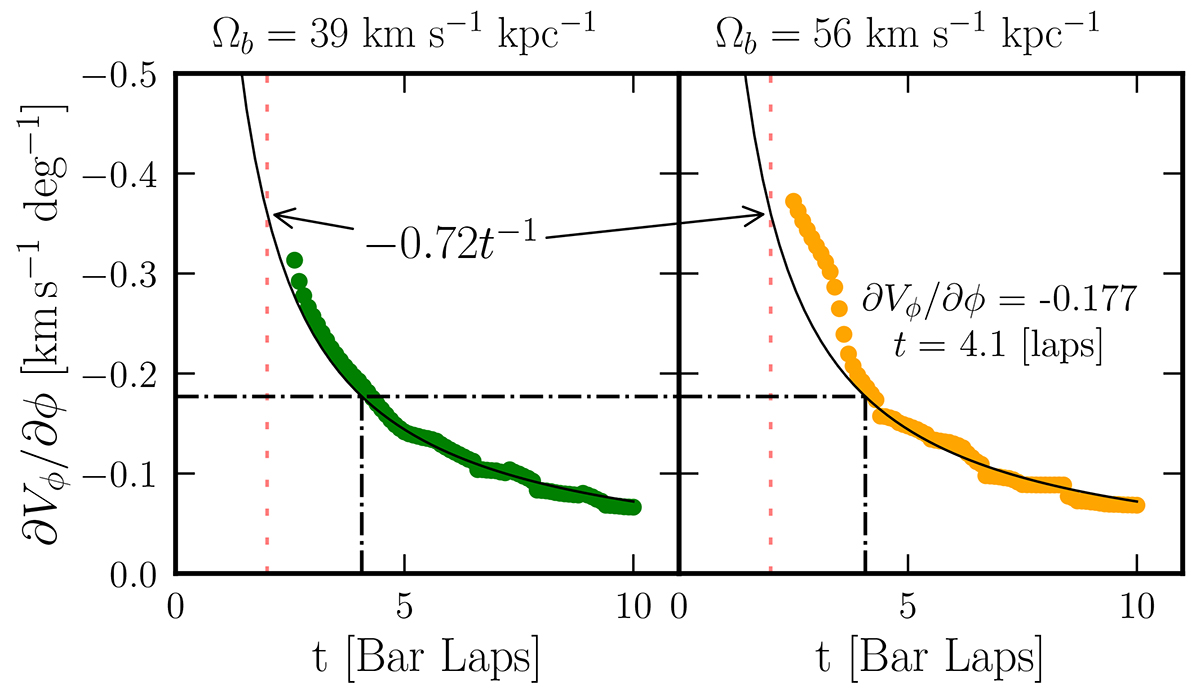
Azimuthal slope of the transient arches at each integration time, for a slow and a fast bar. The black line shows the curve −0.72t−1, which approximates both curves. The dashed black line corresponds to the slope fitted in the data (Fig. 5), and the intersection returns the time estimation. The dashed red line marks the end of the growth of the bar (t = 2 bar laps).
Current usage metrics show cumulative count of Article Views (full-text article views including HTML views, PDF and ePub downloads, according to the available data) and Abstracts Views on Vision4Press platform.
Data correspond to usage on the plateform after 2015. The current usage metrics is available 48-96 hours after online publication and is updated daily on week days.
Initial download of the metrics may take a while.