Fig. 8
Download original image
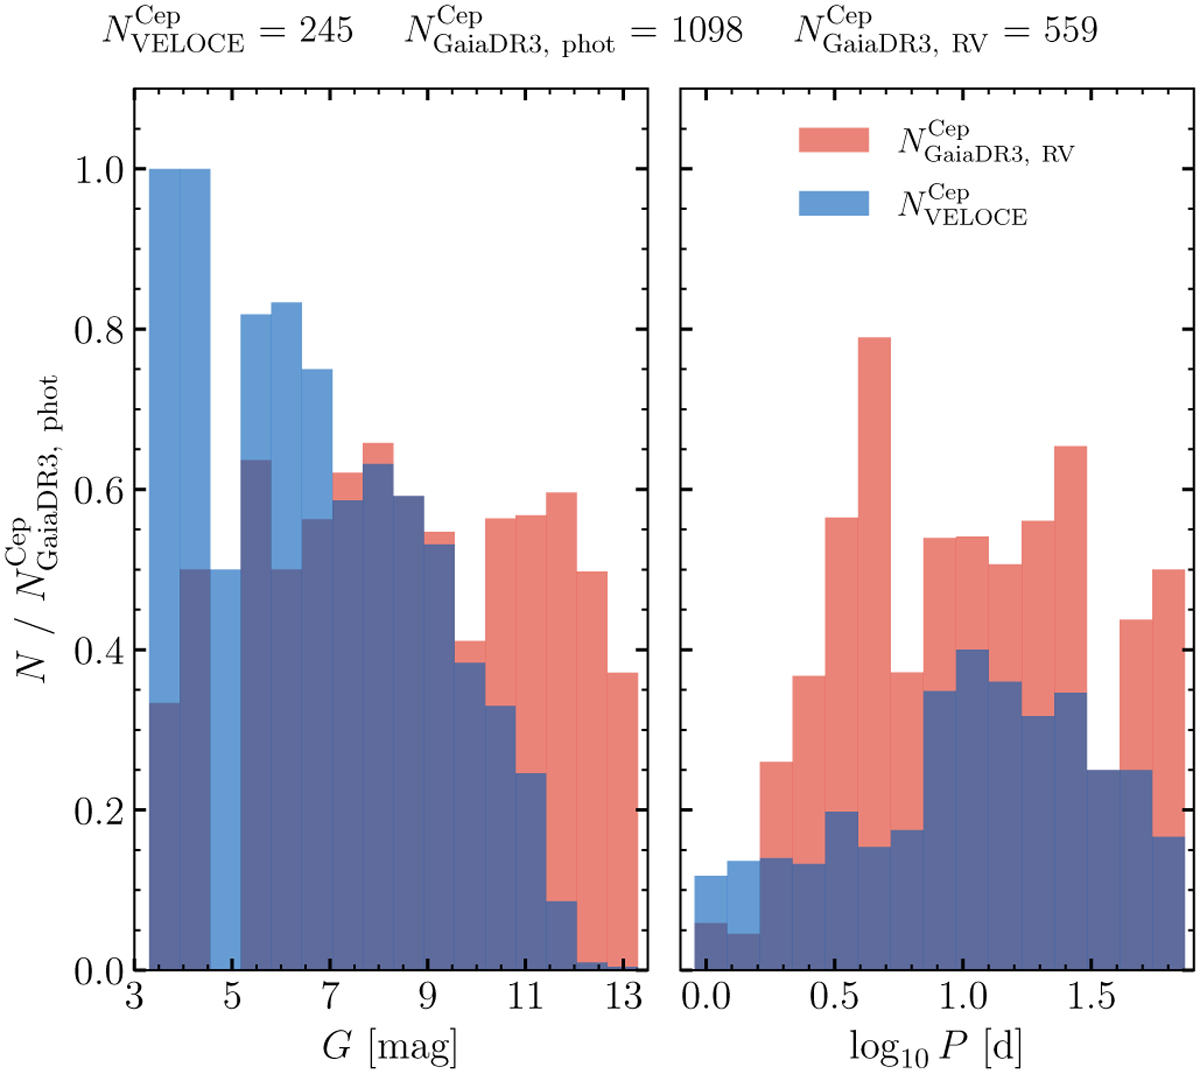
Distributions of the number ratios of Cepheids in VELOCE to those in Gaia as a function of magnitude (left) and Ppuls (right). The comparison is limited to 245 VELOCE Cepheids for which G-band magnitudes are available and to ![]() MW Cepheids in Gaia with G < 13.3 mag and P > 0.9 day.
MW Cepheids in Gaia with G < 13.3 mag and P > 0.9 day. ![]() have published RV time series measurements, cf. Sect. 5.4. Blue histograms show the fraction of VELOCE Cepheids relative to the Gaia sample,
have published RV time series measurements, cf. Sect. 5.4. Blue histograms show the fraction of VELOCE Cepheids relative to the Gaia sample, ![]() , and red histograms show the fraction of Cepheids with Gaia RVs time series measurements relative to the same,
, and red histograms show the fraction of Cepheids with Gaia RVs time series measurements relative to the same, ![]() .
.
Current usage metrics show cumulative count of Article Views (full-text article views including HTML views, PDF and ePub downloads, according to the available data) and Abstracts Views on Vision4Press platform.
Data correspond to usage on the plateform after 2015. The current usage metrics is available 48-96 hours after online publication and is updated daily on week days.
Initial download of the metrics may take a while.