Fig. 7
Download original image
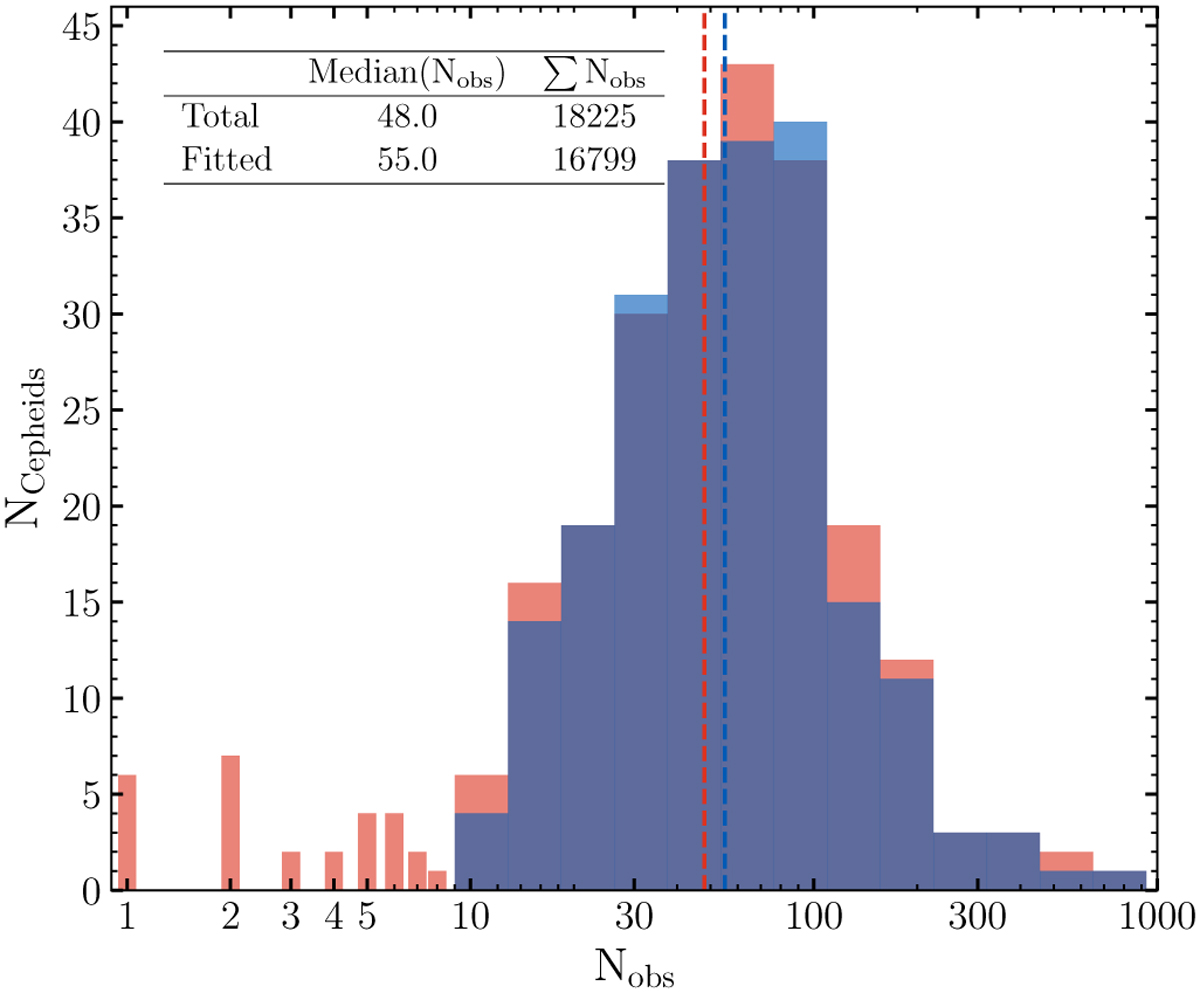
Distribution of the number of observations per Cepheid. The red histogram shows the available number of observations (Nobs) of all Cepheids in VELOCE. The blue histogram shows the number of measurements used to fit Cepheid RV curves (Nobs,fitted). The bin edges are identical for both histograms and logarithmically spaced. The first 8 bins of the red histogram are shown individually to improve readability; a threshold of at least 9 observations was used to fit pulsational models (Sect. 3.3.1). Differences between the blue and red histograms at Nobs > 8 arise due to data selection for model fitting (e.g., in the case of binaries, Sect. 3.3) or additional signals preventing a reasonable fit (Sect. 4.3). The legend summarizes the median and total number of VELOCE observations per group.
Current usage metrics show cumulative count of Article Views (full-text article views including HTML views, PDF and ePub downloads, according to the available data) and Abstracts Views on Vision4Press platform.
Data correspond to usage on the plateform after 2015. The current usage metrics is available 48-96 hours after online publication and is updated daily on week days.
Initial download of the metrics may take a while.