Fig. 33
Download original image
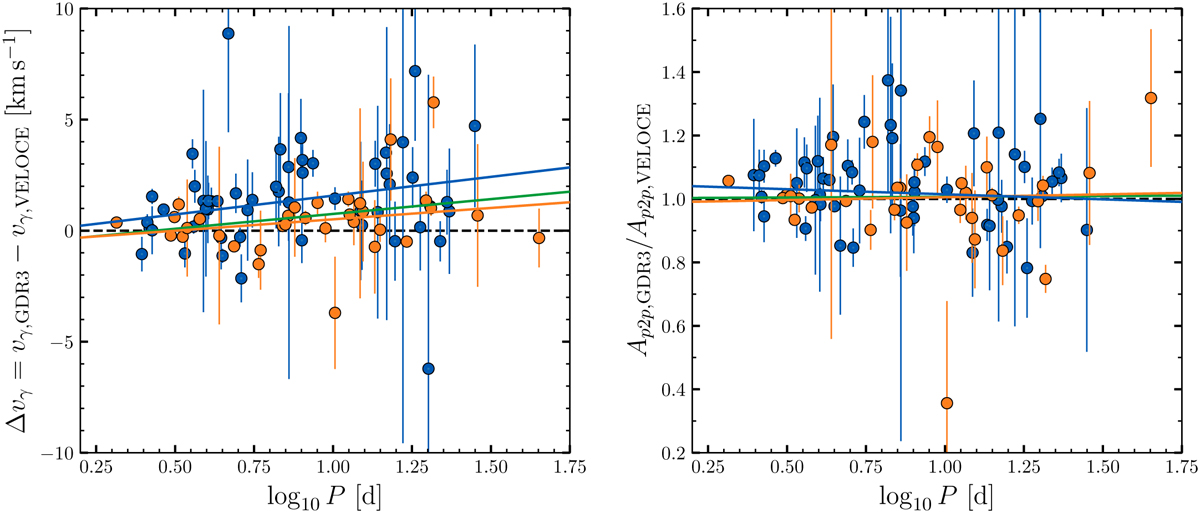
υγ (left) and peak-to-peak RV amplitude (right) determined by Gaia SOS compared to VELOCE as a function of logarithmic pulsation period. υγ,GDR3 and Ap2p,GDR3 are the values published in table gaiadr3.vari_cepheid as parameters average_rv and peak_to_peak_rv, respectively. Orange points highlight Cepheids for which Gaia used the most adequate template parameters. Blue points show measurements processed using template parameters outside this range. Blue and orange solid lines show linear fits to the respective points; green solid lines show linear fits to the combined data sets. At log P = 1, we find Δυγ = 0.51 ± 0.13 km s−1, and a slight trend of 1.03 ± 0.29 km s−1/log P for the orange points. The blue points exhibit a much more significant offset of 1.6 ± 0.2 km s−1 and trend 1.69 ± 0.44 km s−1 / log P. Peak-to-peak amplitudes are generally consistent with a dispersion of approximately 16% and do not exhibit a trend with log P.
Current usage metrics show cumulative count of Article Views (full-text article views including HTML views, PDF and ePub downloads, according to the available data) and Abstracts Views on Vision4Press platform.
Data correspond to usage on the plateform after 2015. The current usage metrics is available 48-96 hours after online publication and is updated daily on week days.
Initial download of the metrics may take a while.