Fig. 27
Download original image
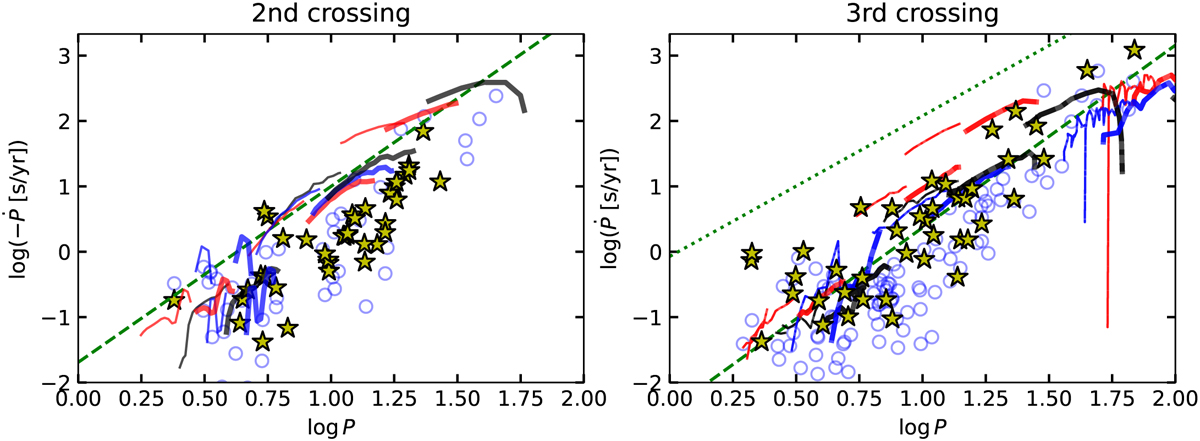
Double-logarithmic plot of linear period changes, ![]() , against Ppuls. Yellow stars show values determined using Δϕ from our template fitting analysis if
, against Ppuls. Yellow stars show values determined using Δϕ from our template fitting analysis if ![]() . Blue circles were measured based on photometry by Csörnyei et al. (2022). Green straight lines are theoretical predictions from Fadeyev (2014, dotted line represents first crossing), blue, red, and black lines are theoretical predictions from Anderson et al. (2016c, for first overtones (thin lines) and fundamental modes with three rotation rates, cf. their Sect. 3.7 and Fig. 13). Left panel: negative
. Blue circles were measured based on photometry by Csörnyei et al. (2022). Green straight lines are theoretical predictions from Fadeyev (2014, dotted line represents first crossing), blue, red, and black lines are theoretical predictions from Anderson et al. (2016c, for first overtones (thin lines) and fundamental modes with three rotation rates, cf. their Sect. 3.7 and Fig. 13). Left panel: negative ![]() indicative of a second instability strip crossing. Right panel: positive
indicative of a second instability strip crossing. Right panel: positive ![]() indicative of a third (rarely: first) instability strip crossing. Overall, we find good agreement between our template fitting-based
indicative of a third (rarely: first) instability strip crossing. Overall, we find good agreement between our template fitting-based ![]() and the literature as well as stellar models.
and the literature as well as stellar models.
Current usage metrics show cumulative count of Article Views (full-text article views including HTML views, PDF and ePub downloads, according to the available data) and Abstracts Views on Vision4Press platform.
Data correspond to usage on the plateform after 2015. The current usage metrics is available 48-96 hours after online publication and is updated daily on week days.
Initial download of the metrics may take a while.