Fig. 24
Download original image
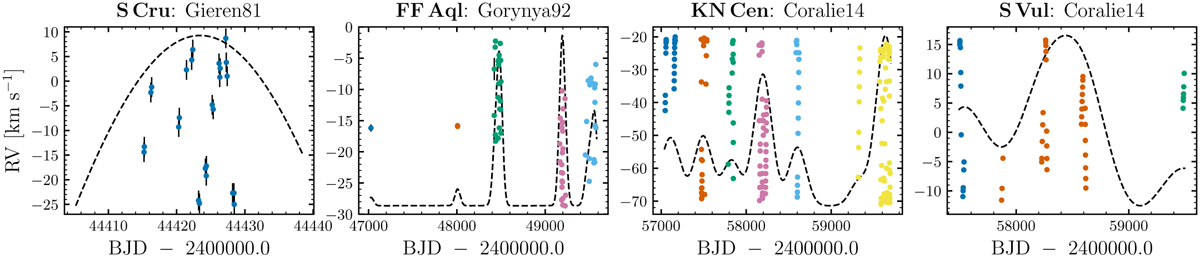
Example of temporal data clustering based on KDE. The solid green lines indicate the kernel density estimate, and data are clustered temporally according to local KDE minima. From left to right: observations of S Cru by Gieren (1981) are insufficiently sampled for temporal clustering and used all together; observations of FF Aql by Gorynya et al. (1998) can and must be clustered during later epochs due to significant orbital motion; observations of KN Cen from VELOCE can be separated into several well-sampled data clusters; S Vul observations in VELOCE were separated into data clusters, although not all clusters could be used due to insufficient data points and rapid period fluctuations.
Current usage metrics show cumulative count of Article Views (full-text article views including HTML views, PDF and ePub downloads, according to the available data) and Abstracts Views on Vision4Press platform.
Data correspond to usage on the plateform after 2015. The current usage metrics is available 48-96 hours after online publication and is updated daily on week days.
Initial download of the metrics may take a while.