Fig. 2
Download original image
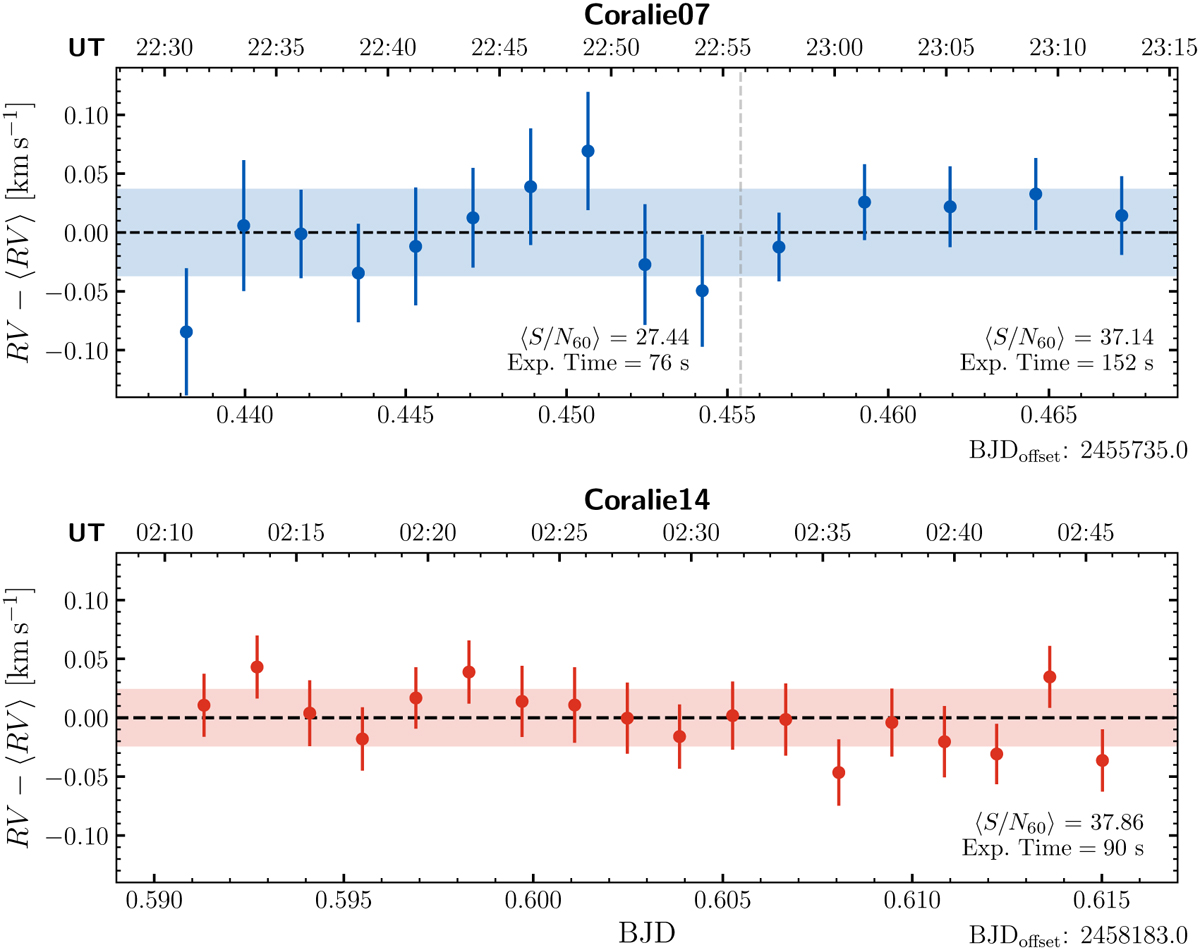
Short-burst (42 and 34 min) RV time series of the 20 days Cepheid RZ Vel near minimum RV collected to test the momentaneous precision of Coralie07 and Coralie14. Both panels show the measured RV minus the mean of the sequence. Shaded areas illustrate the dispersion of the sequences. Average S/N on the 60th echelle order are labeled for reference. Note the improved precision of Coralie14 over Coralie07. Top panel: Coralie07 observations taken on 22 June 2011. Note the change of exposure time (vertical dotted line) that affects both precision and uncertainties estimated by the pipeline. Bottom panel: Coralie14 observations collected on 5 March 2018.
Current usage metrics show cumulative count of Article Views (full-text article views including HTML views, PDF and ePub downloads, according to the available data) and Abstracts Views on Vision4Press platform.
Data correspond to usage on the plateform after 2015. The current usage metrics is available 48-96 hours after online publication and is updated daily on week days.
Initial download of the metrics may take a while.