Fig. 14
Download original image
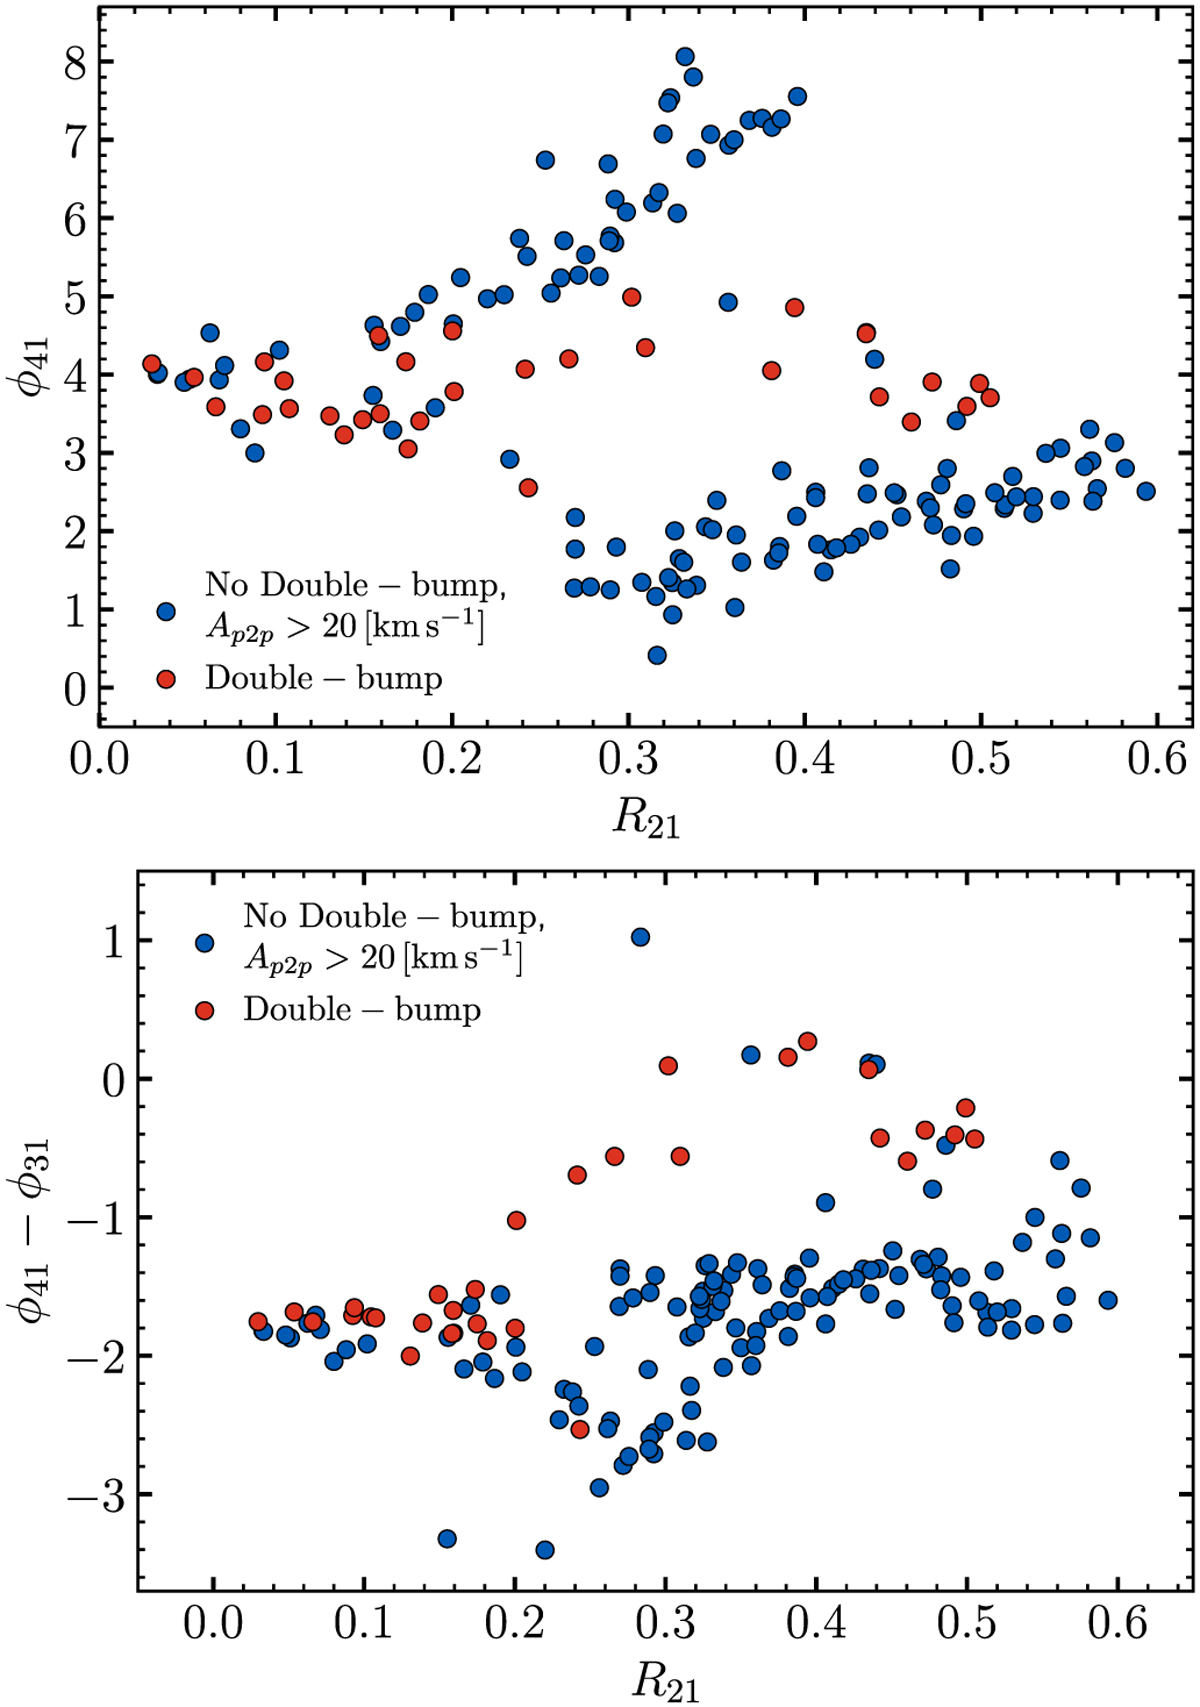
Cepheids exhibiting double bumps on the declining RV curve part stand out in the ϕ41 vs. R21 diagram as a “connecting band” between two otherwise parallel sequences. In ϕ41 − ϕ31 vs. R21, double bump Cepheids also follow a significantly different trend. Plotting these parameters could serve to identify double bumps Cepheids in a quantitative manner rather than by visual inspection of the fits.
Current usage metrics show cumulative count of Article Views (full-text article views including HTML views, PDF and ePub downloads, according to the available data) and Abstracts Views on Vision4Press platform.
Data correspond to usage on the plateform after 2015. The current usage metrics is available 48-96 hours after online publication and is updated daily on week days.
Initial download of the metrics may take a while.