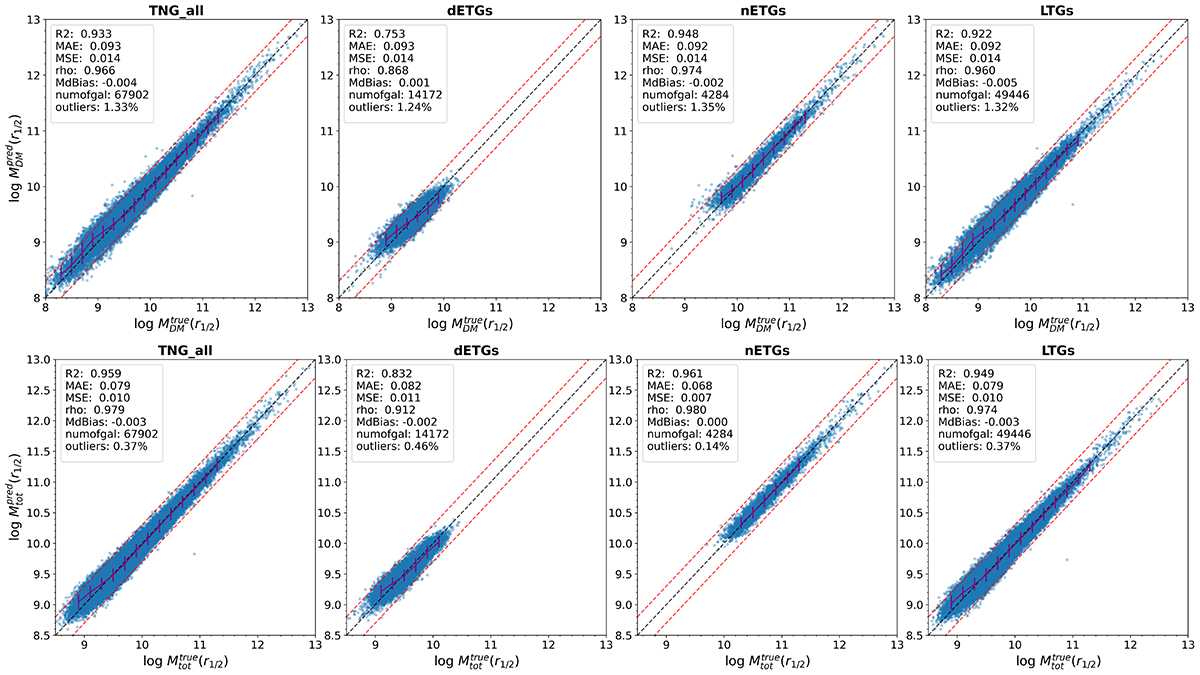
Fig. 4.
Download original image
Self-prediction test using full features as indicated in Table 1, with the full-counts training sample incorporating added measurement errors, as described in Sect. 2.2.2. Top row: target is MDM(r1/2). Bottom row: target is Mtot(r1/2). The results without measurement errors are presented in Appendix B. The data is divided into 80% for training and 20% for testing. The x-axis represents the true values, while the y-axis represents the predicted values. “numofgal” is the number of the test set. The purple error bar represents the 16%, 50%, 84% percentiles as a function of Mtrue(r1/2), with a bin size of 0.2 dex. The red dashed line is ±0.30 dex (corresponding to ∼2σ errors, see text). Outliers are defined as the fraction of data outside the red dashed line. In the case of accurate predictions, the data points are expected to lie along the dotted 1-to-1 line.
Current usage metrics show cumulative count of Article Views (full-text article views including HTML views, PDF and ePub downloads, according to the available data) and Abstracts Views on Vision4Press platform.
Data correspond to usage on the plateform after 2015. The current usage metrics is available 48-96 hours after online publication and is updated daily on week days.
Initial download of the metrics may take a while.