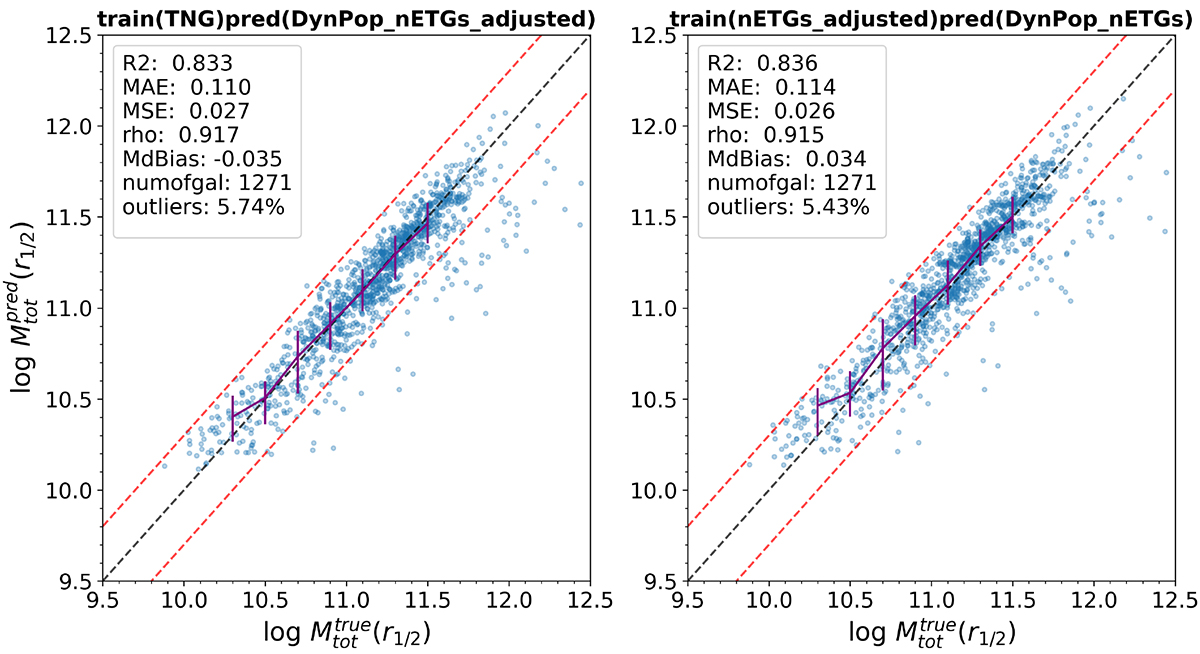
Fig. 17.
Download original image
Prediction results of the DynPop_nETGs sample with three features: M⋆, r1/2, and σ, as indicated in Figs. 9 and 10. Left panel: prediction made by correcting the r1/2 of the Dynpop_nETGs by increasing 0.10 dex with MELA_ALL, as discussed in Sect. 5.2.1. This correction is applied due to a potential offset between observation and simulation, as shown in Fig. 16 top row. Right panel: prediction made by correcting both r1/2 and M⋆ of the nETGs (i.e., the training sample of MELA_NETG). Specifically, the r1/2 is decreased by 0.14 dex, and the M⋆ is decreased by 0.30 dex. The adjusted mass-size relation is shown in Fig. 16. This correction is applied because of the anticipated offset arising from different cosmology settings between simulation and observation, as discussed in Sect. 5.2.3. In comparison to Figs. 9 and 10, the prediction is observed to improve after these adjustments.
Current usage metrics show cumulative count of Article Views (full-text article views including HTML views, PDF and ePub downloads, according to the available data) and Abstracts Views on Vision4Press platform.
Data correspond to usage on the plateform after 2015. The current usage metrics is available 48-96 hours after online publication and is updated daily on week days.
Initial download of the metrics may take a while.